
Figure 10.
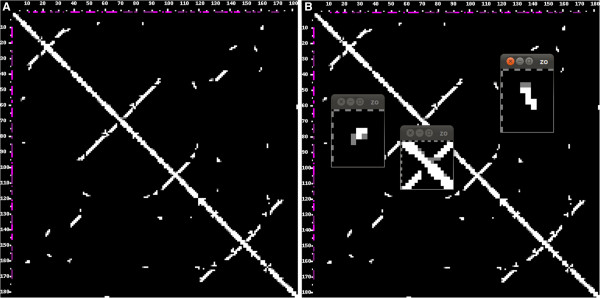
Comparison of a crystal structure and a comparative 3D model, in 2D. The homology model is compared to the crystal structure. Contacts have been calculated using the N1/N9 metrics and 9.5 Å threshold (1U6B_B, 3D picture shown in Figure 9). A) The lower left triangle displays the contacts in the crystal structure, the upper right triangle those in the model. B) The right picture additionally highlights three regions where the contacts differ, in particular one tertiary interaction site (left), one loop (center) and one junction (right).