
Figure 4.
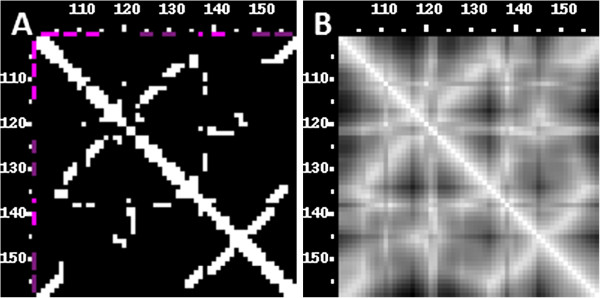
Contact vs distance maps. A) A contact map of 23S rRNA fragment (the same structure as in Figure 2) calculated for N1/N9 atoms with a 9.5 Å distance threshold. All contacts are shown as white squares. Purple and violet bars along the sequence ruler indicate RNA secondary structure. B) A distance map for the same molecule and metric. The contact map shows only binary information, while the distance map represents the degree of proximity by the shades of grey (white color symbolizes a distance equal to zero).