
Figure 6.
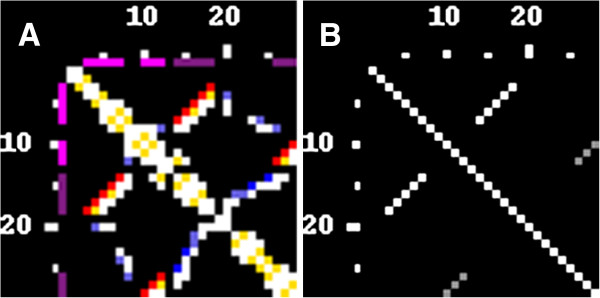
RNA secondary structure. Base pairs have been classified by RNAView. A) A contact map (PDB id 1L2X, see: Figure 5 for a traditional rendering) calculated using the threshold of 9.5 Å, using N1/N9 atoms; canonical base pairs are shown in red, other base pairs are in blue, stacking interactions are shown in yellow and other contacts are in white. B) The RNA secondary structure (Watson-Crick base pairs only) was saved in the Vienna format and reloaded in the contact map form. The grey color indicates residues participating in pseudoknot pairings.