
Figure 3.
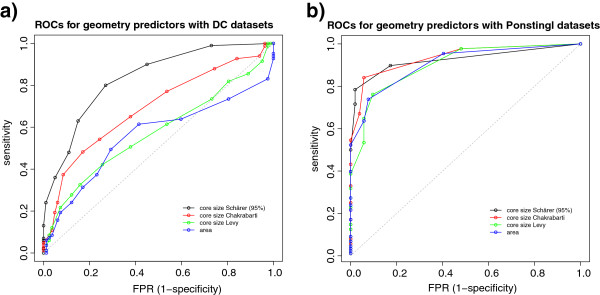
ROCs for different geometric indicators. The ROC curves represent the predictive power of different geometric parameters: core size (Schärer’s definition), core size (Chakrabarti’s definition), core size (Levy’s definition) and total buried surface area. In panel a) the datasets used are our DCbio/DCxtal, whilst in panel b) the Ponstingl datasets were used. Not much difference can be appreciated if using Ponstingl’s dataset, since it contains interfaces that are too clearly separable by area. When we use the DC datasets, it becomes apparent that Schärer’s core definition exhibits superior performance compared to the other geometric indicators.