Figure 1.
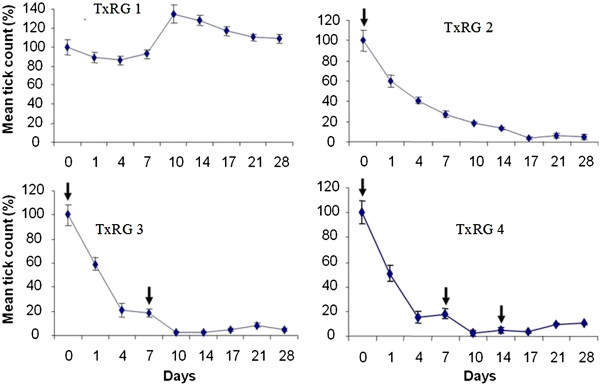
The mean ± SEM for tick counts in different treatment regime groups (TxRG) and TxRG 1 is the control group. Ecotix® was applied on day 0 for TxRG 2, days 0 and 7 for TxRG 3 and days 0, 7 and 14 for TxRG 4. Tick counting was done on day 0, 1, 4, 7, 10, 14, 17, 21 and 28. The results are presented as percentage of change in tick counts from day 0 to 28. Note that the tick counts in the control group (TxRG 1) on average remained constant. As a post Ecotix® application effects on day 0 in TxRG 2, tick count decreased from 100% to 5%, in TxRG 3, the tick counts decreased from 100% to 4% and in TxRG 4, the tick counts decreased from 100% to 10%. The second dosage on day 7 in the TxRG 3 and TxRG 4 dramatically reduced the total tick count in these two groups compared to the TxRG 2. Spontaneously, the tick loads in TxRG 3 and TxRG 4 started to increase as noted on day 14, 17, 21 and 28 of counting. No difference in the total number of tick between the TxRG 3 and TxRG 4. Represents treatment days.

