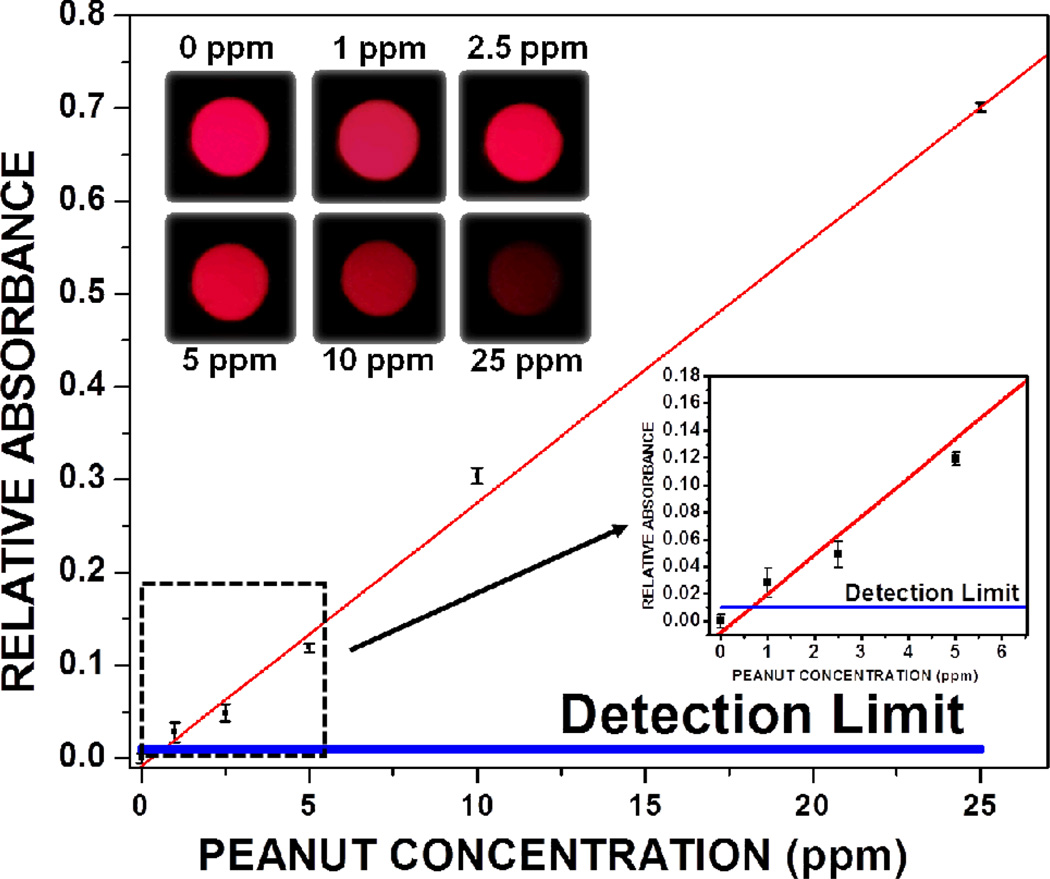
Fig. 3.
Dose-response curve for peanut allergen detection through iTube platform is illustrated. For this curve, 6 different sets of calibration samples (0, 1, 2.5, 5, 10 and 25 ppm) were measured and converted into relative absorbance values (i.e., A). The inset shows that even very low absorbance values can be quantified, yielding ~ 1 ppm as our minimum detectable peanut concentration, calculated by adding twice the standard deviation to the control tube signal level.

