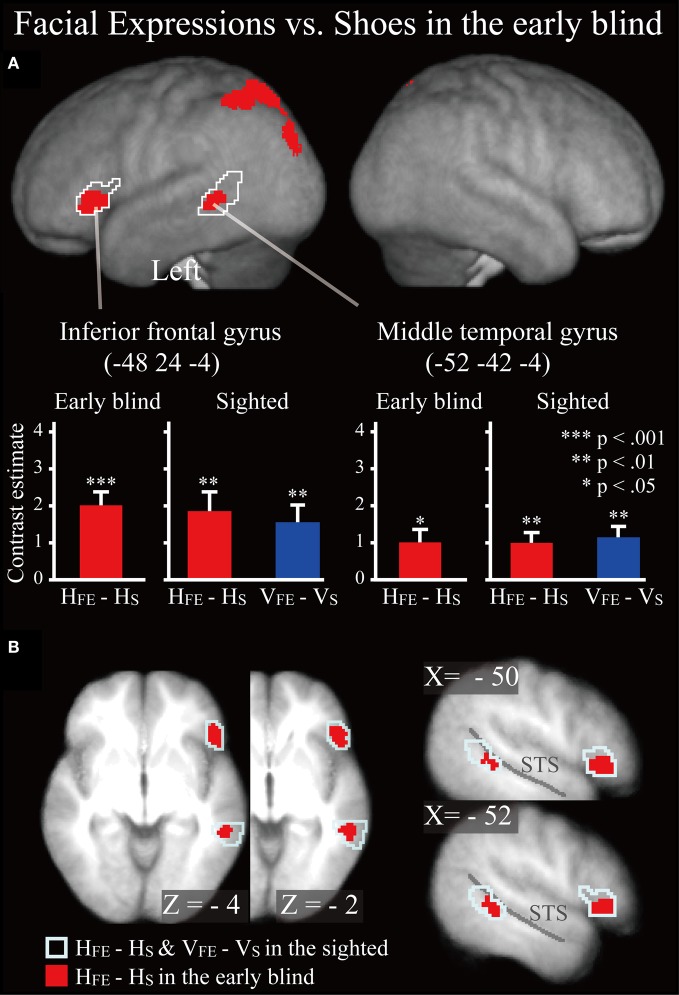
Figure 6.
SPM of the average neural activity within the early blind group during haptic identification of facial expressions compared with shoes (HFE − HS). (A) The activation patterns were superimposed on a surface-rendered T1-weighted high-resolution MRI averaged across the subjects. The white lines indicate regions activated during haptic and visual recognition in the sighted group (see Figure 5B). The bar graphs indicate the contrast estimates (i.e., activity) for identification of facial expressions relative to shoes using a volume of interest with a sphere of 8-mm diameter (corresponding to the size of the spatial-smoothing kernel applied to these data). Asterisks indicate the results of one-sample t-tests. Data are presented as the mean ± SEM of 17 early blind subjects. (B) The activation patterns were superimposed on the sagittal and transverse sections. The blue lines indicate regions activated during haptic and visual recognition in the sighted group.

