
Figure 7.
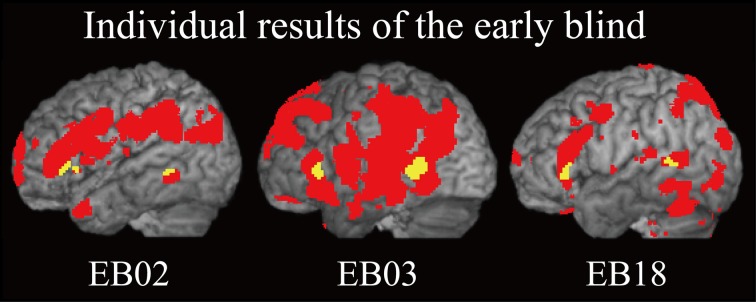
Individual analysis on brain regions activated by identification of facial expressions (relative to that of shoes) in the early blind group. The activation patterns during identification of FEEs relative to shoes were superimposed on a surface-rendered T1-weighted high-resolution MRI of each individual. The yellow-colored regions indicate overlap with regions of activation in the sighted group (Figure 5B, yellow-colored regions). Note that all of the three individuals were totally blind from birth. The height threshold was set at Z > 2.58, uncorrected for multiple comparisons.