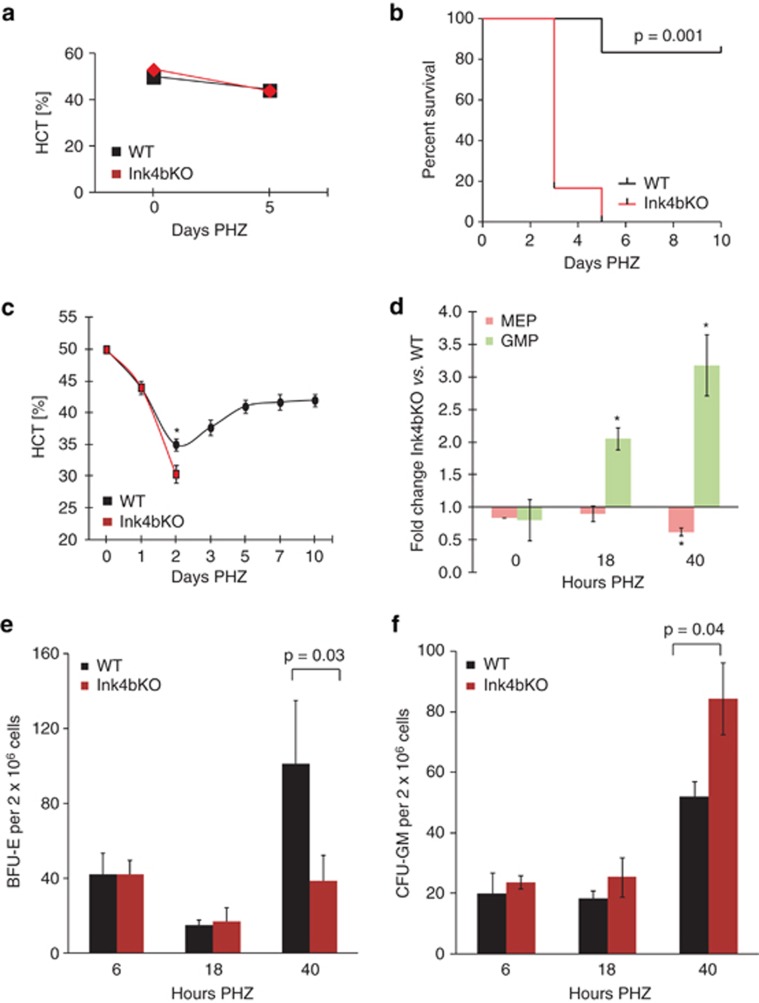
Figure 3.
Response of mice lacking p15Ink4b to hematopoietic stress induced by PHZ. (a) Hematocrit (HCT) levels following injection of 50 mg/kg PHZ on two consecutive days (n=10). (b) Survival curve of mice following single injection of 100 mg/kg PHZ (wild type (WT), n=6; Ink4bKO, n=7). (c) Hematocrit levels following injection of 100 mg/kg PHZ. *P=0.03 (n=3). (d) Relative decrease in the number of MEPs and increase in the number of GMPs in the spleen of Ink4bKO animals as compared with WT animals following PHZ injection. Comparison of Ink4bKO vs WT mice. *P=0.02 at 18 h and *P=0.03 at 40 h (n=4). (e and f) Decreased numbers of erythroid BFU-E colonies and increased numbers of myeloid CFU-GM colonies in the spleen of Ink4bKO animals as compared with WT animals following PHZ injection (n=3).

