
Figure 2.
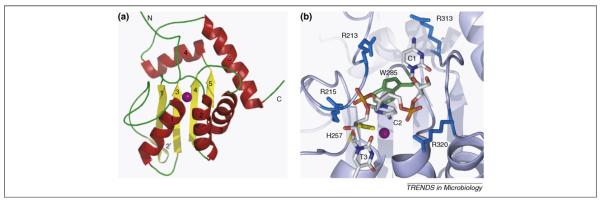
NMR structure of APOBEC3G and a model for substrate DNA binding. (a) Ribbon representation of the NMR structure of A3G [11]. Beta strands are shown in yellow and are numbered 1–5 (2′ indicates a short disrupted β strand); α helices are shown in red and are numbered 1–5. A purple sphere indicates the position of the zinc ion. (b) Model of the interaction of APOBEC3G with a trinucleotide 5′-C1-C2-T3–3′ DNA substrate. C2 represents the nucleotide that is being edited and is flipped out from the phosphodiester backbone for positioning towards the catalytic zinc ion (purple) and H257 (yellow). W285 (green) can facilitate positioning of C2 through stacking interactions. Arginines are shown in blue, and several conserved arginines of APOBEC3G have the potential to interact with the DNA. R213, R215 and R320 are shown in close proximity to the DNA backbone phosphates, whereas R313 could interact with C1.