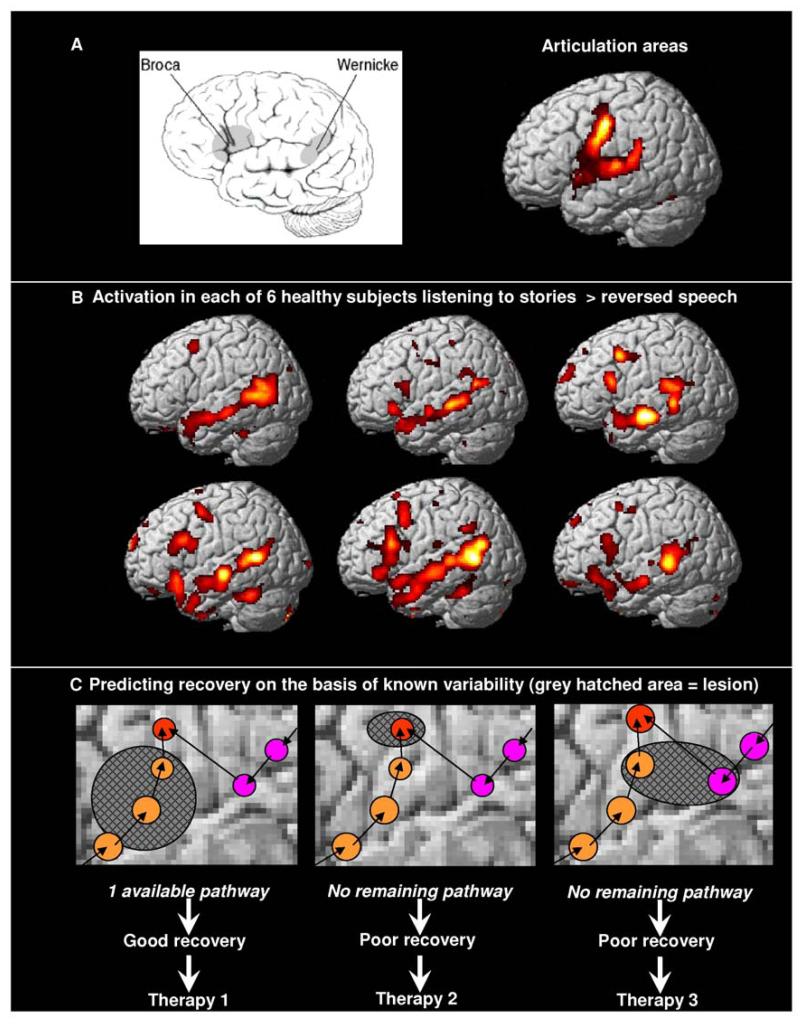
Figure 1. Brain activation during speech processing and the predicted effects of lesions.
A. Left Schematic illustration of Broca’s area and Wernicke’s area. Right: fMRI activation for reciting the phrase “1,2,3.” This articulation task activates the same set of regions in the left and right hemisphere (right hemisphere not shown).
B. fMRI activation in each of 6 healthy subjects listening to stories relative to listening to meaningless reversed speech.140 During this speech comprehension task, all 6 subjects consistently activate Wernicke’s area in the posterior superior temporal cortex. In addition, activation is consistently observed in the anterior superior temporal cortex and inconsistently observed in Broca’s area.
C. Schematic and hypothetical illustration of the effects of lesions (grey hatched areas) when there are two alternative pathways (orange and pink) to the same output (red). The effect of the lesion depends on whether one of the pathways remains intact. Although this is more likely after a small lesion, it is not so much the size of the lesion that matters but where the lesion occurs. For example, the middle configuration has a small lesion that knocks out an area that is critical to all both pathways whereas the left configuration has a large lesion that leaves one pathway intact. The lesion in the right configuration illustrates how damage to two pathways can have a much more devastating effect than damage to one pathway. The effect of the lesion on recovery will influence the most appropriate type of therapy.

