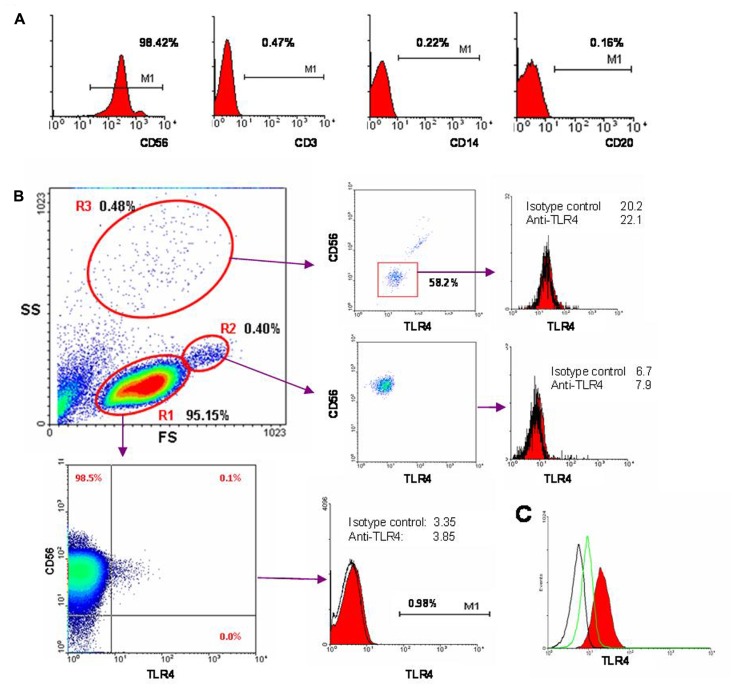
FIGURE 2.
Cytometric analysis of NK cell population purity and expression of TLR4. (A) Freshly isolated NK cells were stained with fluorochrome-labeled antibodies CD3-FITC, CD14-PE, CD20-PerCP, and CD56-APC and analyzed by flow cytometry. (B) Here is shown one of typical results from 18 blood samples used in these experiments. Expression of TLR4 was measured using anti-TLR4-FITC antibody (clone HTA125). Forward scatter (FS) versus side scatter (SS) is presented. Three regions of live cells can be distinguished based on morphology. R1 region (95.15% of all events) consists of CD3-CD56+ NK cells (98.6%). CD56- cells do not express TLR4. A small population of CD56+TLR4dim cells (±0.1%) is detected. On the histogram TLR4 level and isotypic control are shown. R2 region (0.4%) consists of NK cells doublets. R3 region (0.48%) corresponds to granulocytes. (C) Intracellular TLR4 expression in NK cells. Black line – autofluorescence control, green – isotype control, red – fixed cells, labeled with anti-TLR4-FITC.

