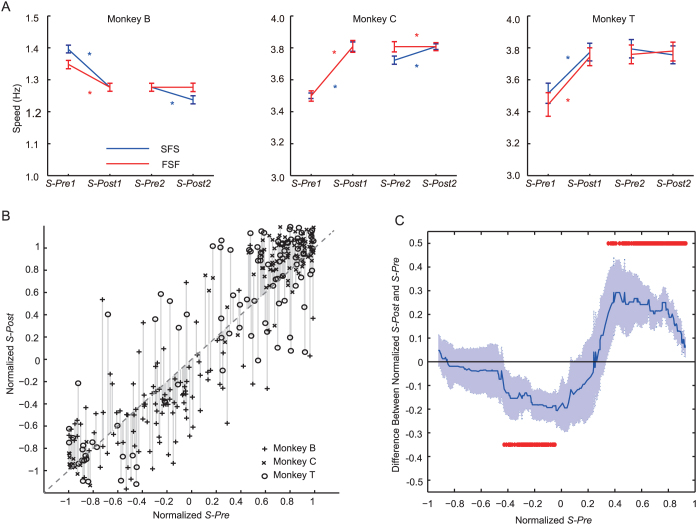
Figure 3. The change in BP speed in the monkeys before and after speed switching of vMonkey.
(A) The change in BP speed for each monkey in trial phases under each condition. The median of 10 BPs before and after of each speed-switch were compared (S-Pre1 vs. S-Post1, and S-Pre2 vs. S-Post2). The blue and red lines represent the Slow-Fast-Slow (SFS) and Fast-Slow-Fast (FSF) conditions, respectively. Asterisks represent a significant difference between before and after speed switching (p < 0.05, Wilcoxon rank-sum test; see text for details). Error bars represent the 95% confidence interval of the median. (B) The normalized S-Pre (including S-Pre1 and S-Pre2) and S-Post (including S-Post1 and S-Post2) scores for all trials. The data from different monkeys are represented with different symbols. The vertical lines represent the distances between normalized S-Post and S-Pre. The diagonal dashed line represents normalized S-Post = normalized S-Pre. (C) The median distance between normalized S-Post and S-Pre. The red asterisks indicate significant differences of the medians from zero (p < 0.05, Wilcoxon signed-rank test). The shaded area represents the 95% confidence interval of the median.

