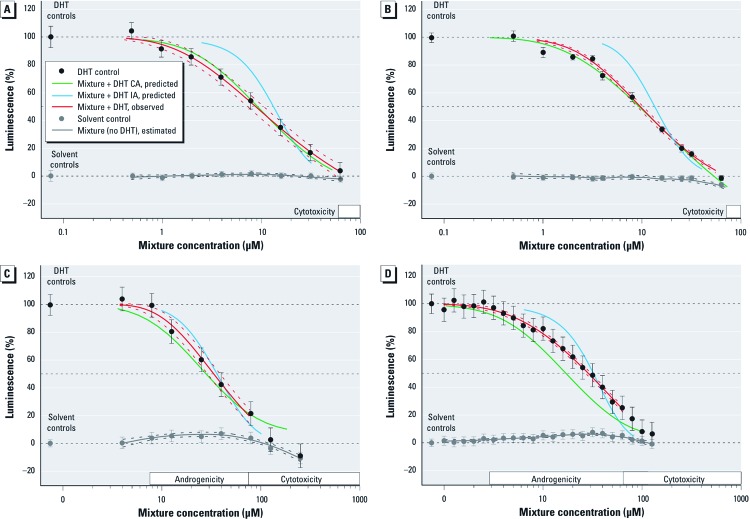
Figure 1.
Predicted and observed antiandrogenic activity (mean responses ± SDs) of mixtures with 8 pesticides composed in the ratio of their individual IC10 values (A) and IC01 values (B), with 5 pesticides mixed in the ratio of their individual IC01 values (C), and with 13 pesticides mixed in the ratio of their individual IC10 values (D). Observed mixture effects are from at least three independent mixture experiments and shown as mean ± SD, predicted effect curves were calculated using the model of CA and IA. Regression fit of the observed effects is shown as solid red line, with the dotted red lines indicating the corresponding 95% CI. Estimated mean effect (solid gray line) and 95% CI (dotted gray lines).

