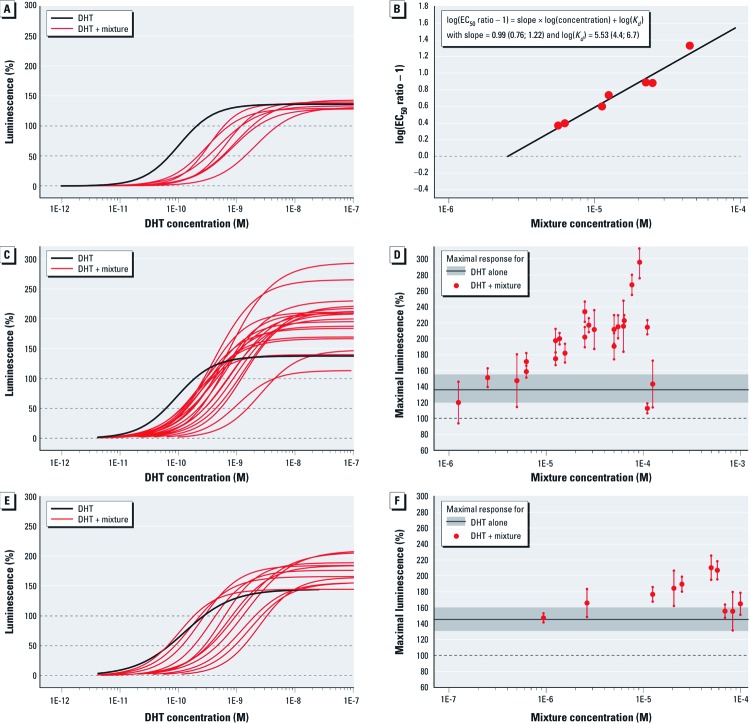
Figure 2.
Antiandrogenic activity of DHT in the presence of fixed mixture concentrations of 8 pesticides (IC10 mixture ratio, A); 5 pesticides (IC01 mixture ratio, C); and 13 pesticides (IC01 mixture ratio, E). (B) Schild regression plot for the mixture of 8 pesticides. (C,F) Estimated maximal effect levels (mean and 95% CI) in response to the 5‑ and 13-component mixtures, respectively; gray shading indicates the average maximal effect level (and 95% empirical confidence belt) of DHT alone on the basis of all experiments.

