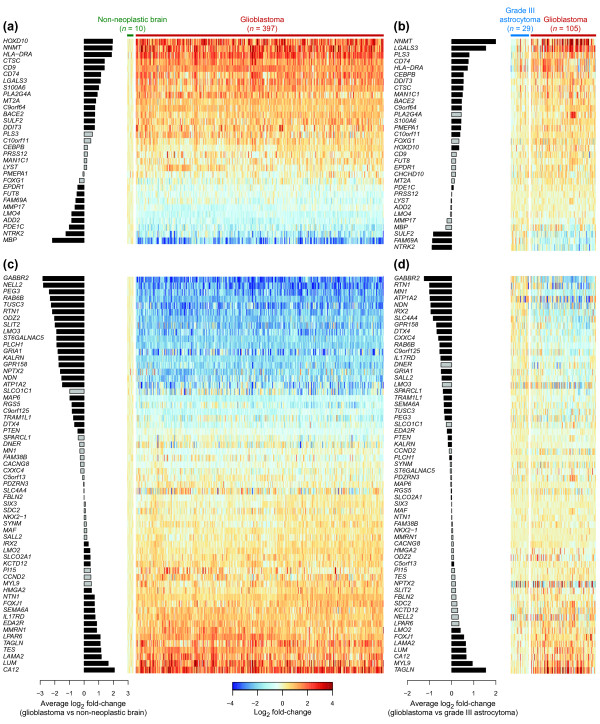
Figure 3.
Core gene expression changes in GNS lines are mirrored in glioblastoma tumors. (a-d) Expression in tumors for genes that are strongly upregulated (a,b) or downregulated (c,d) in GNS cells. The gene sets were identified by comparison of Tag-seq expression profiles for GNS and NS cell lines (see main text). Bars depict average fold-change between glioblastoma and non-neoplastic brain tissue (a,c) (TCGA data set) and between glioblastoma and grade III astrocytoma (b,d) (Phillips and Freije data sets combined). Black bars indicate genes with significant differential expression in the microarray data (P < 0.01). Heatmaps show expression in individual samples relative to the average in non-neoplastic brain (a,c) or grade III astrocytoma (b,d). One gene (CHCHD10) not quantified in the TCGA data set is omitted from (a).

