
Figure 2.
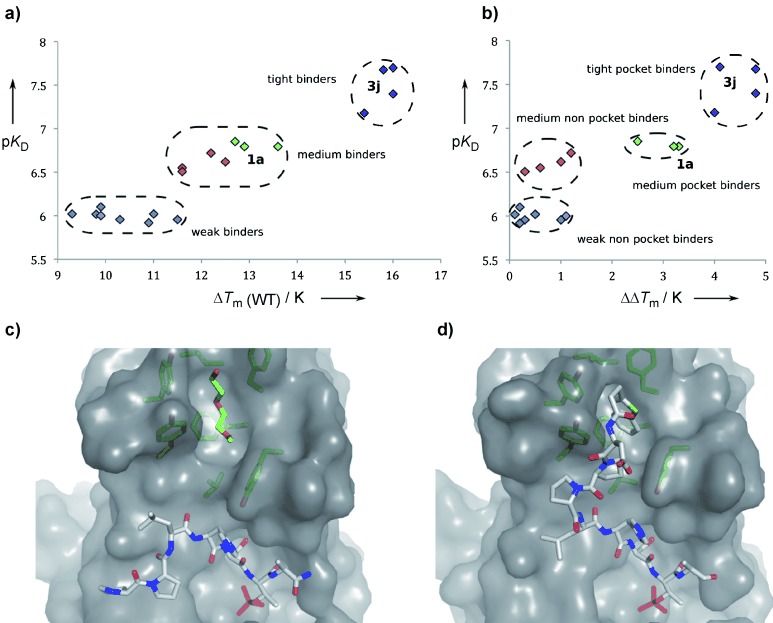
Interpretation and validation of the assay data. a) A plot of pKD vs. ΔTm shows a correlation between thermal shift and binding affinity; b) a plot of pKD vs. ΔΔTm(WT) distinguishes two binding modes leading to increased affinity of modified peptides—pocket-dependent and independent; colors of the data points in (a, b) reflect classification of binders into one of four groups: weak nonpocket (blue), medium nonpocket (red), medium pocket (green), and tight pocket (magenta) and are as in Table 1; c) the structure of 2 a bound to the protein shows it does not bind to the pocket, which is occupied by PEG300; d) the structure of 3 j shows that it binds in the pocket, as indicated by the FTS assay.