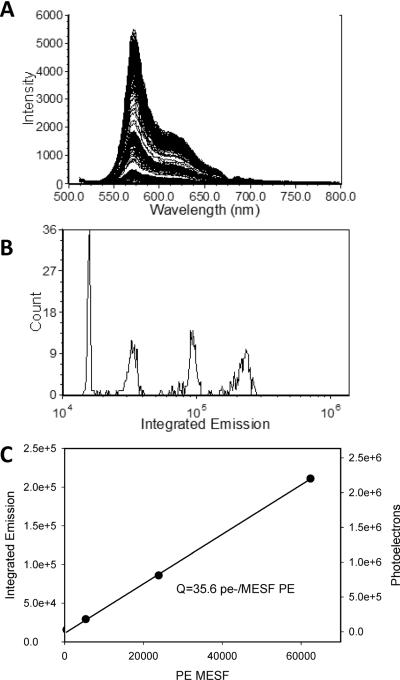
Figure 4. Intensity calibration using single fluorophore calibration beads.
A) Spectral flow cytometry data of PE calibration beads (PE Quantibrite, BD Biosciences). B) Histogram of Integrated Emission intensity for the calibration bead set. C) plot of calibration bead MESF value vs Integrated Intensity and the number of photons detected, as calculated from the detector response.

