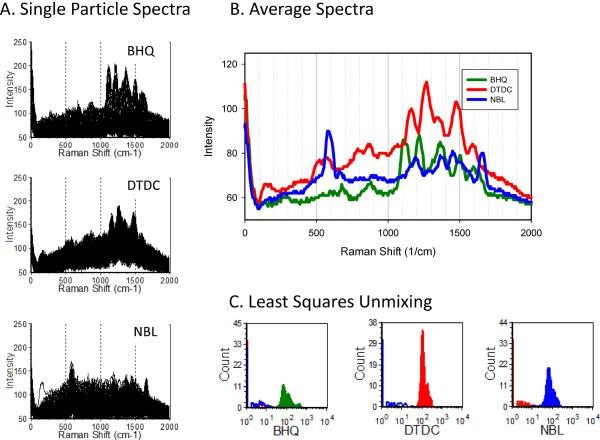
Figure 6. SERS tag-labeled particles: spectral unmixing.
Avidin-coated beads labeled with different biotinylated SERS tags were analyze by spectral flow cytometry. A) Spectra of individual beads B) average particle spectra for each SERS tag. C) Contribution of each SERS tag as estimated using CLS spectral unmixing.

