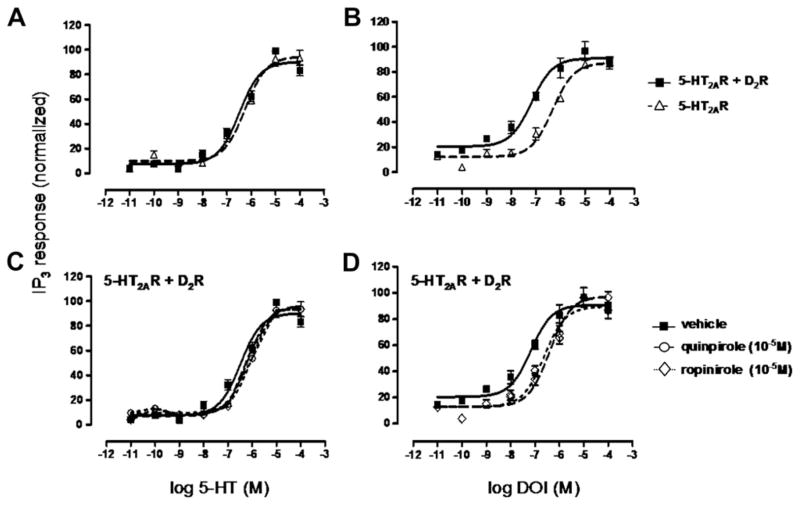
Fig. 2.
Inositol Phosphate (IP) production induced by 5-HT2AR activation with natural agonist 5-HT or hallucinogenic drug DOI. A, Serotonin (5-HT)-stimulated 5-HT2AR in HEK293 cells expressing 5-HT2AR (△) and HEK293 cells co-expressing 5-HT2AR and D2R (■). D2R expression does not affect 5-HT-induced 5-HT2AR-IP3 production (EC50 = 5.5 × 10⁻⁷ M). B, DOI-stimulated 5-HT2AR in HEK293 cells expressing 5-HT2AR (△) (EC50 = 3.8 × 10⁻⁶ M) and HEK293 cells co-expressing 5-HT2AR and D2R (■) (EC50 = 6.7 × 10⁻⁸ M). D2R expression increases DOI-induced 5-HT2AR-IP3 production. C, D2R agonists (10−5 M), quinpirole (○) (EC50 = 6.6 × 10⁻⁷ M) and ropinirole (◇) (EC50 = 8 × 10⁻⁷ M), have no effect on 5-HT-induced 5-HT2AR-IP3 production (vehicle; EC50 = 5.5 × 10⁻⁷ M). D, D2R agonists (10−5 M), quinpirole (○) (EC50 = 3.9 × 10⁻⁷ M) and ropinirole (◇) (EC50 = 2.4 × 10⁻⁷ M) decrease DOI-induced 5-HT2AR-IP3 production (vehicle; EC50 = 6.7 × 10⁻⁸ M). Data are means ± SEM for each experiment performed in triplicate. The EC50 values shown are for this single experiment. Averages of EC50 values over all experiments can be found in Table 2.

