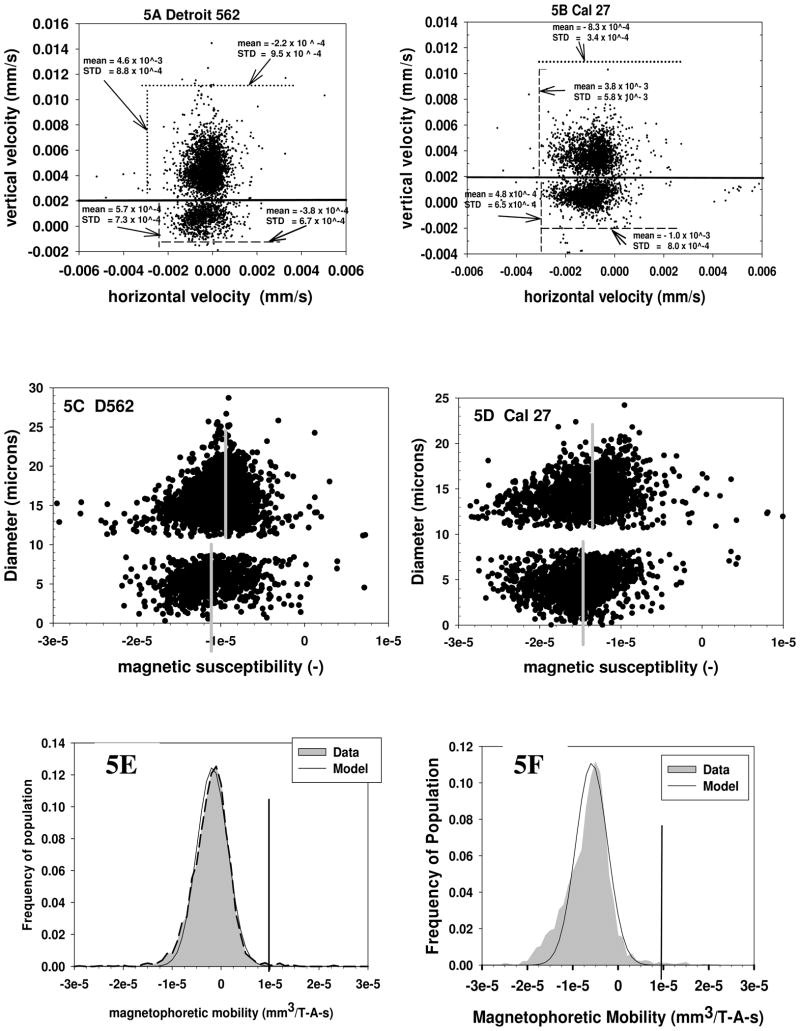
Figure 5.
Dot plot of settling velocity, y axis, and magnetically induced velocity, x axis, for Detroit 562, (5A) and Cal 27, (5B), human cancer cell lines. Both cell suspensions were spiked with 4.5 micron polystyrene microspheres and these microspheres are represented by the lower densities of dots in both Figures. Figures 5C and 5D correspond to the calculated diameters (y axis) and magnetic susceptibility. Figures 5E and 5F are the corresponding magnetophoretic mobility histograms for the two cancer cell lines.

