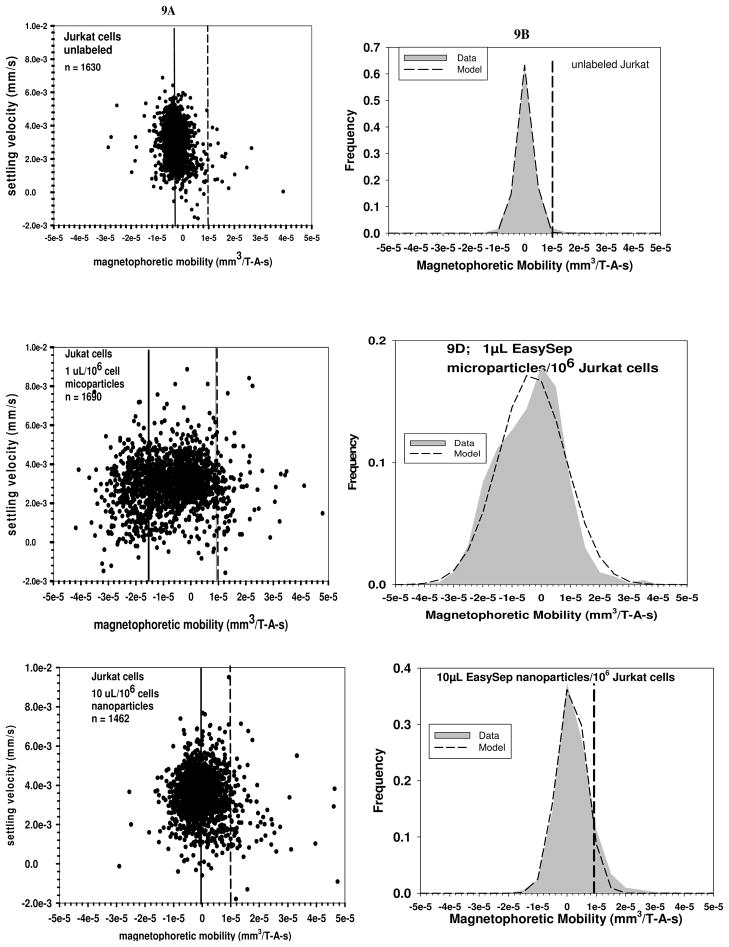
Figure 9.
Figures 9A through 9F are representative dot plots of settling velocity versus magnetophoretic mobility for unlabeled Jurkat cells, 9A and 9B, Jurkat cell incubated with 1 microLiter per 106 cells of Stem Cell Technologies microparticles, 9C and 9D, and Jurkat cells incubated with 10 microLiter per 106 cells of Stem Cell Technologies nanoparticles, 9E and 9F. The vertical solid line is the mean mobility of the cells, and the dotted line corresponds to a mobility of 1 × 10⁻⁵ mm3/T-A-s.

