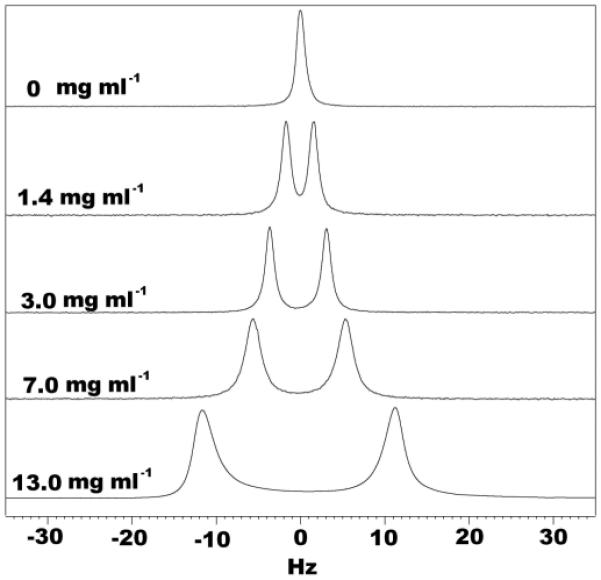
Figure 1.

1D 2H spectra of collagen gel samples in 200 mM tris, 200 mM NaCl, pH 8.0, 90%/10% H2O/D2O with different initial collagen concentration. These spectra were recorded at 37°C with four scans and a sweep width of 300 Hz on a Bruker DMX 600 MHz spectrometer.
