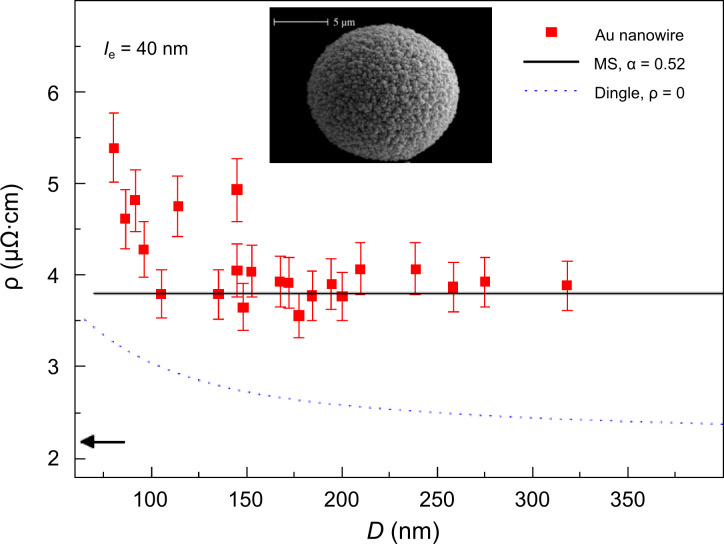
Figure 16.
Specific electrical resistivity versus wire diameter for single polycrystalline gold nanowires (ammonium gold(I) sulfite electrolyte, T = 50 °C, U = −0.8 V) together with the cap morphology. The symbols represent the data. The continuous and dashed lines are a fit of the resistivity predicted by the Mayadas and Shatzkes and the Dingle models, respectively. Adapted with permission from [135] – Copyright 2008 Elsevier B.V.

