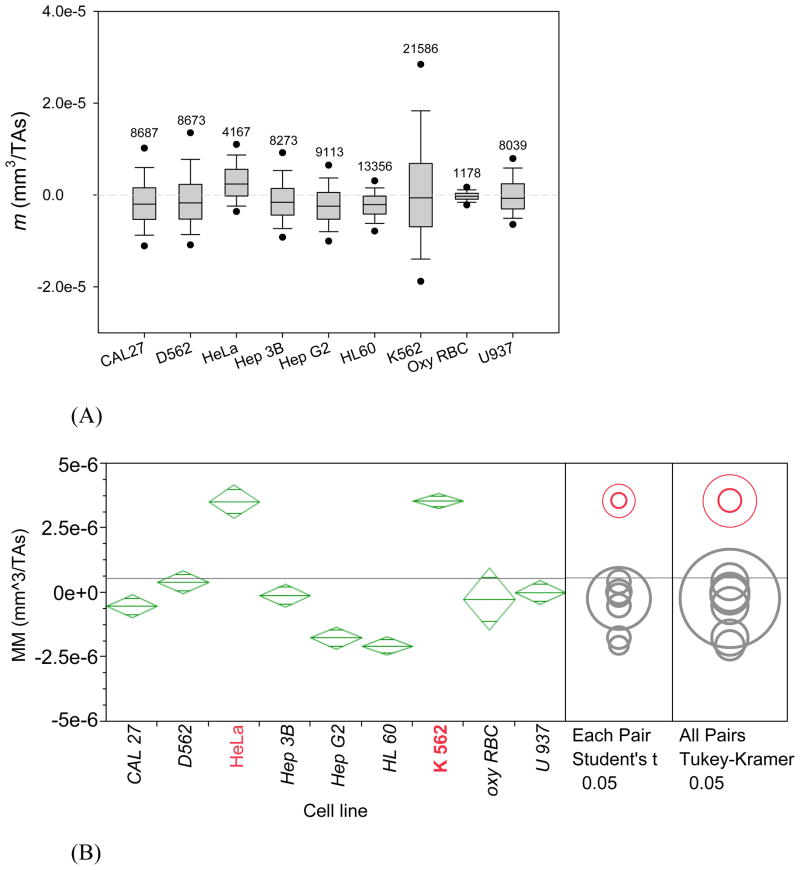
Figure 2.
MM distributions (m) of all the eight cancer cell lines incubated in the complete media (plus deoxygenated RBC as a control). (A) Non-parametric box & whiskers plots: (25th, 75th), (10th, 90th), and (5th, 95th) percentile ranges are indicated by boxes vertical extension, whiskers and dots, respectively; the median value by a line inside the box; the number of cells tracked is indicated on top. (B) Same data represented by mean (diamond center line) & 95% confidence intervals (CIs, diamond cuts by vortices). Horizontal grey line shows mean for all data. HeLa and K-562 cells MM values were identified as significantly higher from those of other types of cells at p<0.05 by statistical tests indicated on the right.

