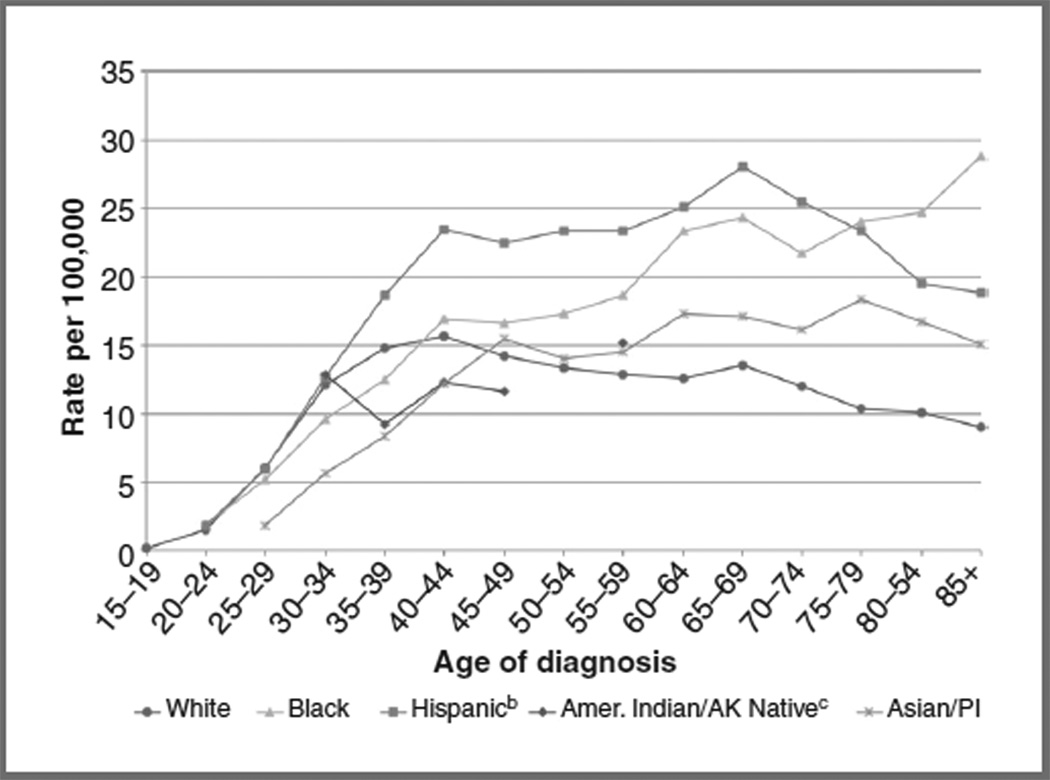
Figure 2.
Age-specific incidencea of ICC in the United States, 2000 to 2008, by race/ethnicity. aIncidence data are from the SEER 17 areas (San Francisco, Connecticut, Detroit, Hawaii, Iowa, New Mexico, Seattle, Utah, Atlanta, San Jose-Monterey, Los Angeles, Alaska Native Registry, Rural Georgia, California excluding San Francisco/San Jose-Monterey/ Los Angeles, Kentucky, Louisiana, and New Jersey). bHispanic is not mutually exclusive from whites, blacks, Asian/Pacific Islanders, and American Indians/Alaska Natives. Incidence data for Hispanics are based on NHIA and exclude cases from the Alaska Native Registry. cRates for American Indian/Alaska Native are based on the CHSDA(Contract Health Service Delivery Area) counties. Notes: SEER 17 cancer incidence data are collected from population-based cancer registries covering 26.2% of the U.S. population. Source: SEER (9). AK, Alaskan; Amer, American; PI, Pacific Islanders.

