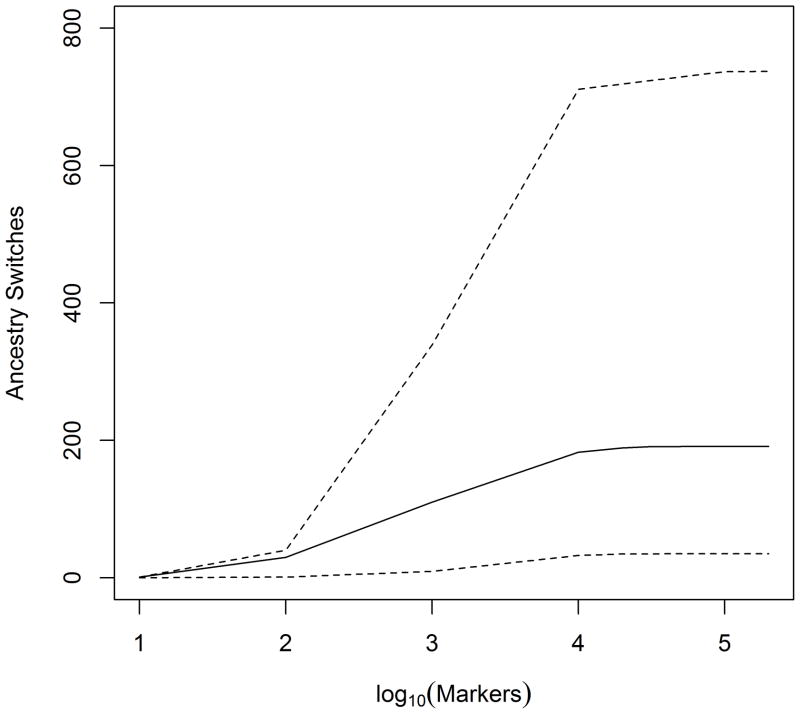
Figure 2.
Marker density to detect all ancestry switches. The number of ancestry switches detected as a function of marker density for an individual with the median number (n = 191, solid line) or most extreme numbers (n = 35 or 737, dashed lines) of ancestry switches among 1,976 African Americans (Adeyemo et al., 2009). For admixed African Americans, high-throughput genotyping of approximately 1 million markers using commercially available microarrays is more than sufficient to extract all of the information on local ancestry.

