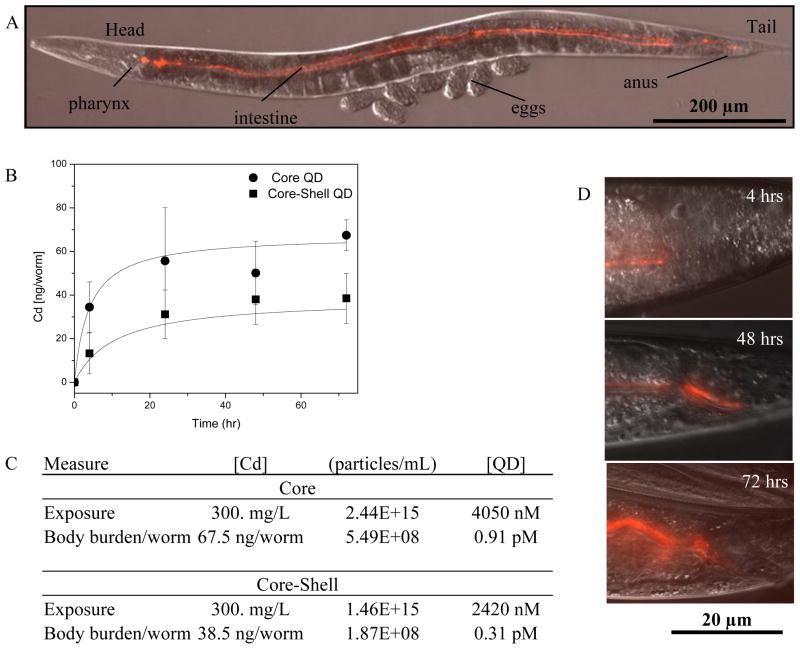
Figure 1.
(A) Internalized QDs. DIC image with color overlay of the entire nematode showing the anatomy: head, body, and tail. (B) The uptake profile of QDs based on body burden of internalized cadmium and (C) the exposure concentrations for each QD by ICP-OES. Data shown are mean + SE (n = 5). (D) Red fluorescence channel showing the tail region near the anus of the worm after 4, 48 and 72 h of exposure. The exposure concentration was [Cd] = 300 mg/L. As time goes on, more fluorescence is observed consistent with the measurements of the body burden for cadmium (B). Anterior is left and dorsal is up in all of the figures.

