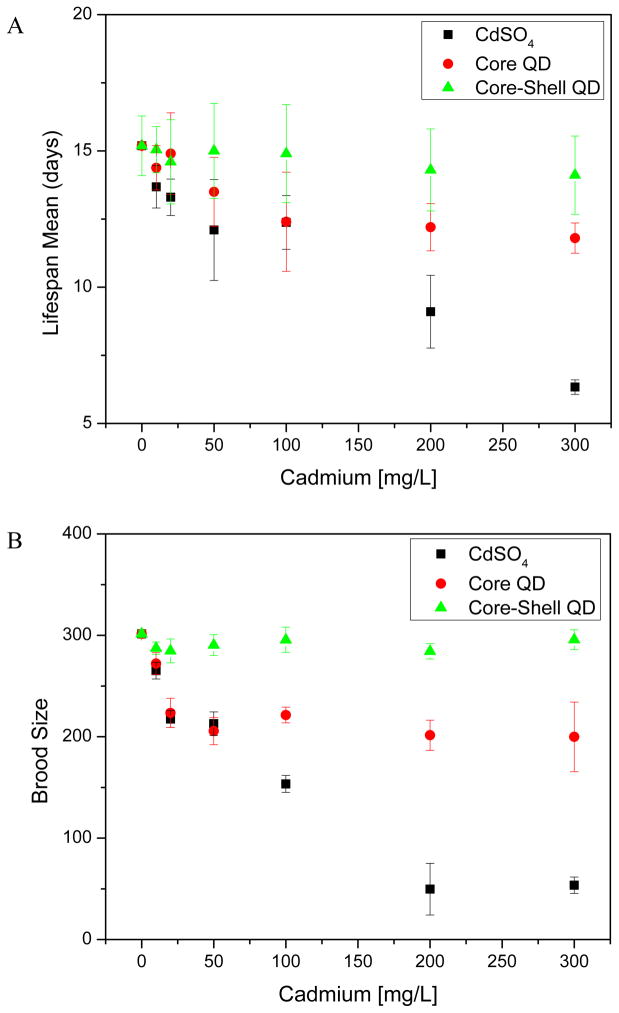
Figure 2.
Range-finding toxicity response curves. (A) C. elegans life span mean of generation 1 after QD and chemical acute exposures. (B) Exposure related effect on brood size of adult nematodes of generation 1. Error bars indicate standard error of means from 12 independent experiments for each data point.

