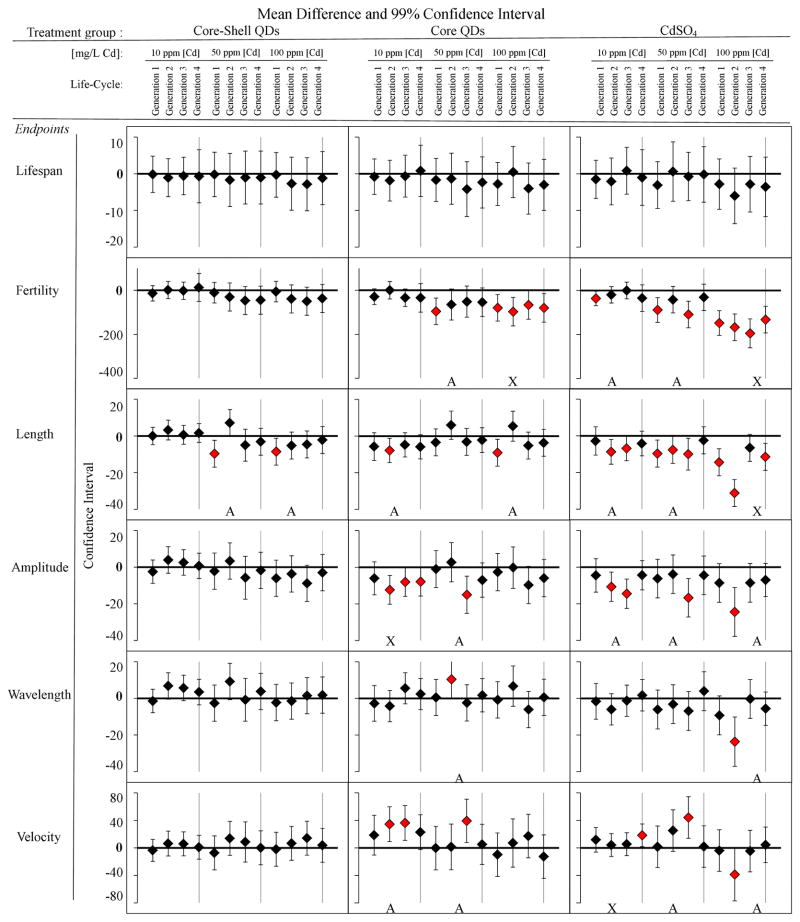
Figure 3.
Multigenerational chronic exposure effects in multiple endpoints: lifespan, fertility, growth, and locomotion (amplitude, wavelength, velocity) for four generations at low (10 mg/L) medium (50 mg/L), and high (100 mg/L) concentrations of equivalent cadmium for each sample tested: core-shell QDs, core QDs, and CdSO4. An A represents multi-generational data in which the effect in subsequent generations is different than the first generation. An X indicates continual adverse effects over multiple generations. Each horizontal bar represents the mean differences against the untreated control (ANOVA and post-hoc Tukey test with 99% confidence interval). If the interval excludes 0, then the difference is considered significant (red marker) for that pair-wise comparison (n=12).

