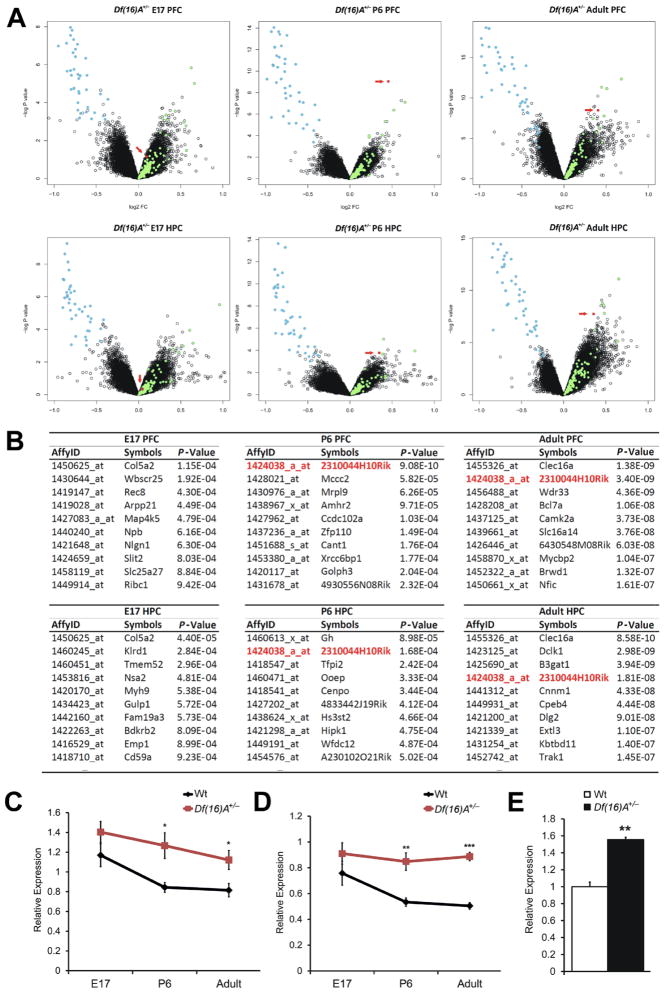
Figure 2. 2310044H10Rik (Mirta22) is robustly upregulated in the brain of Df(16)A+/− mice.
(A) Changes in gene expression in the PFC (upper panel) or HPC (lower panel) of Df(16)A+/− and Wt littermate control mice at E16, P6 and adulthood (n = 10 each group): Volcano plot of the P-values and the corresponding relative expression of each gene. Light blue dots indicate genes within Df(16)A deficiency; light green dots indicate upregulated miRNA-containing transcripts; red dots indicate probe sets representing Mirta22.
(B) Top 10 protein encoding genes that show significant upregulation in the PFC (upper panel) or HPC (lower panel) of Df(16)A+/− and Wt littermate mice at E16, P6 and adulthood. Mirta22 is highlighted in red.
(C, D) Temporal expression of 2310044H10Rik (Mirta22) in the PFC (C) and HPC (D) of Df(16)A+/− and Wt littermate mice as monitored by qRT-PCR. n = 9–10 for each group.
(E) Increased expression of endogenous 2310044H10Rik (Mirta22) in DIV9 hippocampal neurons isolated from Df(16)A+/− animals as assayed by qRT-PCR (n = 3 each genotype). Expression levels in mutant neurons were normalized to Wt neurons.
Results are expressed as mean ± SEM. *P < 0.05, **P < 0.01, ***P < 0.001 (Student’s t- test). See also Figure S2, Tables S1 and S2.

