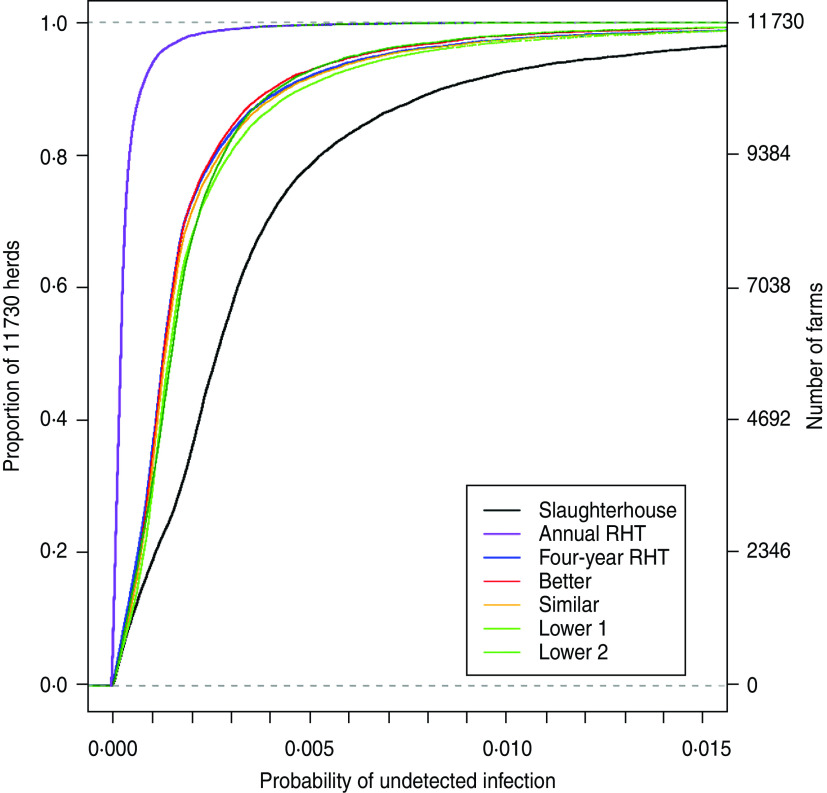
Fig. 2.
Cumulative distribution plot of the probability of each herd harbouring undetected infection at the end of each model time step for all herds in Scotland from the three baseline models. The ‘Slaughterhouse only’ scenario represents a minimal model (the lowest amount of surveillance that could be under) and the ‘Annual routine herd testing’ scenario is the maximal model (the most surveillance that could be undertaken under the current testing regimens). The remaining four scenarios are the four risk-based surveillance systems. The x axis has been truncated for clarity.

