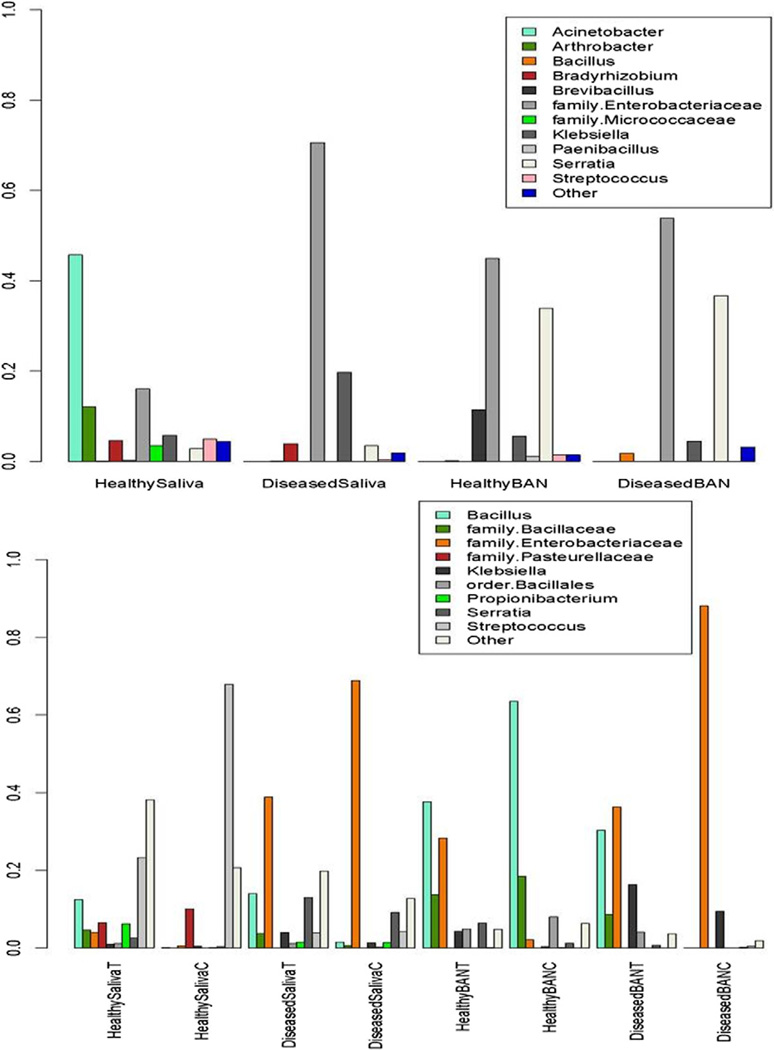
Fig. 1.
Proportions of various taxonomic groups across the ambient samples (top graph) and mitomycin C control/BRONJ samples (bottom graph) for control and BRONJ saliva and biofilms. BAN, Biofilms; BANT, BRONJ biofilms; BANC, control biofilms. Only groups that accounted for ≥1% of the data in ambient samples and ≥5% of the data in control/BRONJ samples are shown. The category “other” denotes the remainder of the data in each case.

