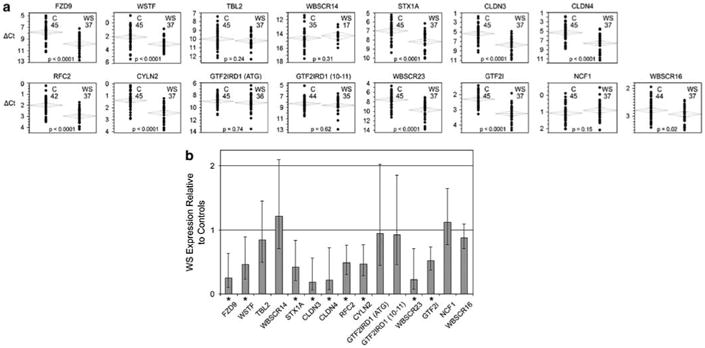
Figure 2.

Quantitative expression of 14 genes in William's syndrome. Expression is decreased for many but not all deleted genes. (a) Plots of bivariate analysis for each gene; values for each normal control subject (left) and William's syndrome subjects (right) are normalized to ACTB and shown as ΔCt. Number of subjects in each group is also shown. (b) Bar graph showing each gene's median expression and s.d. (expression in normal controls=1;*=P<0.0001). Data for these calculations are in Supplementary Table 1. Error range is determined by evaluating the expression: 2−ΔΔCt with Δ ΔCt+s and ΔΔCt−s, where s= the standard deviation of the Δ ΔCt value according to User Bulletin No. 2: ABI Prism 7700 Sequence Detection System, December 1997 (Applied Biosystems).
