
Figure 4.
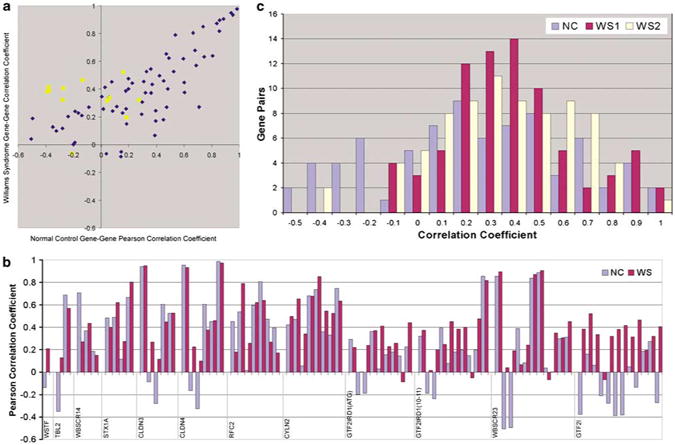
Pairwise correlation of expression of WS-deleted-region genes in WS subjects and normal controls. Correlation of GTF2I expression with that of other genes (■) reveals a set that are significantly positive in WS and significantly negative in normal controls. (a) Pearson correlation coefficients of gene pairs in normal controls (x axis) and William's syndrome group 1 (y axis); coefficients less than ±0.35 are not significant (P>0.05). (b) Quantitative pairwise gene to gene correlations used for 4a, displayed as bar graphs. These show that gene-to-gene correlations are similar in magnitude and direction in WS and NC except for GTF2I. The order of gene-to-gene correlations begins with the gene denoted at the left of the plot versus FZD9 then adds genes in genomic order from left to right. (for example, first comparison is WSTF versus FZD9, then TBL2 versus FZD9, TBL2 versus WSTF, followed by WBSCR14 versus FZD9, WBSCR14 versus WSTF, WBSCR14 versus TBL2, etc.). Note that among the largest differences in correlation coefficients between NC and WS are with GTF2I and FZD9, STX1A, CLDN3, CLDN4 and WBSCR23. These correlations change sign and are significant for both NC and WS. (c) Pairwise correlations of deleted WS genes in normal controls (NC), WS group 1 (WSG1) and WS Group 2 (WSG2). The degree of coexpression of CLDN3 and CLDN4 in NC, WSG1 and WSG2 is notable compared to other neighboring genes on chromosome 7 that are oriented head to head and located 50–70kb apart as shown in Supplementary Figure 1.