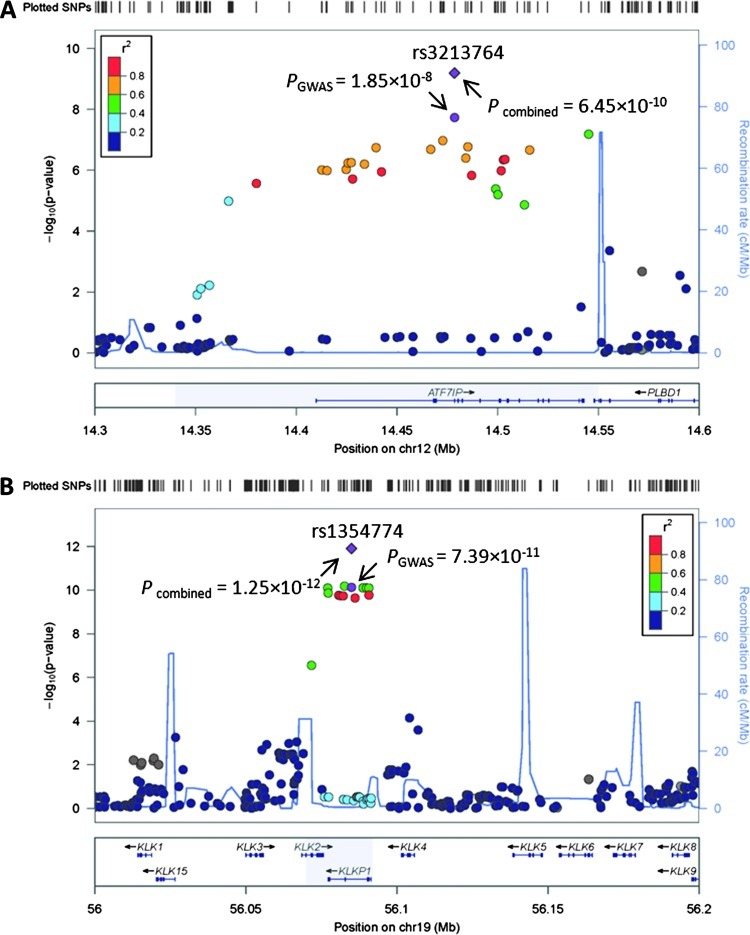
Figure 2.
Regional plots of the associations between 12p13 (A) and 19q13 (B) and %fPSA. Associations of individual SNPs have been plotted as -log10 P against the chromosomal position. Results of both genotyped and imputed SNPs are shown. Colors indicate the LD strength between themost significant SNPs (shown at the top of each plot with a point in purple) and the other SNPs assessed. The right Y-axis shows the recombination rate estimated from the 1000 Genomes Utah residents with Northern and Western European ancestry (CEU) population.

