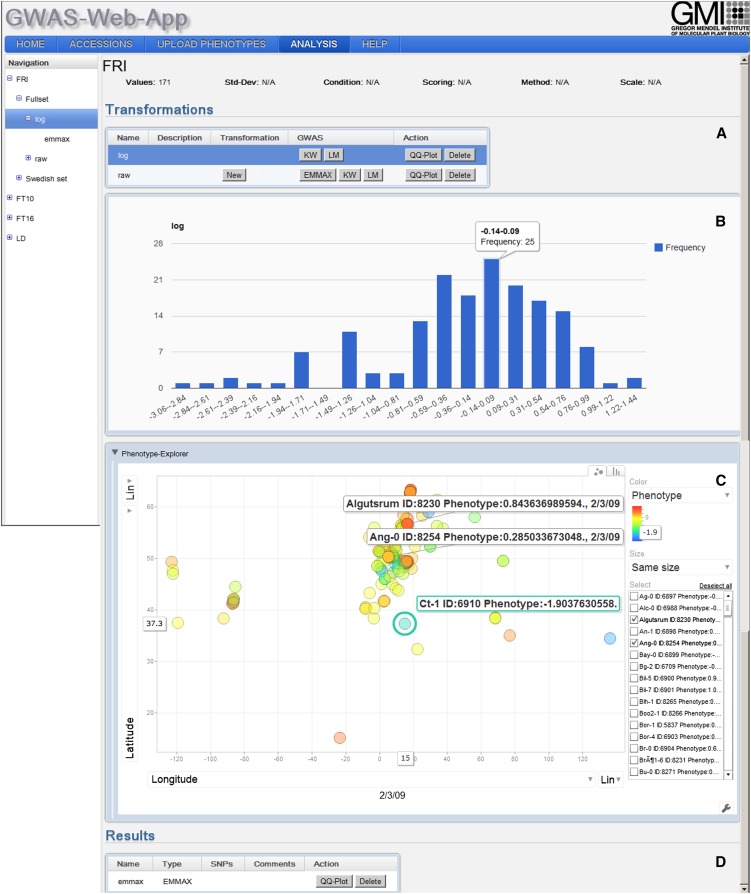
Figure 3.
Transformation View.
The transformation view consists of four panels. The list of stored transformations is displayed in (A). The use can create a new transformation, delete an existing one, or run one of three available GWAS analysis methods on the transformed phenotype values. Dependent on the selected transformation a histogram of the transformed phenotype values are displayed below the transformation list (B). The Accession-Phenotype-Explorer (C) visualizes additional accession information through a bar chart or a scatterplot. Panel (D) shows the stored GWAS results for the specific transformation.

