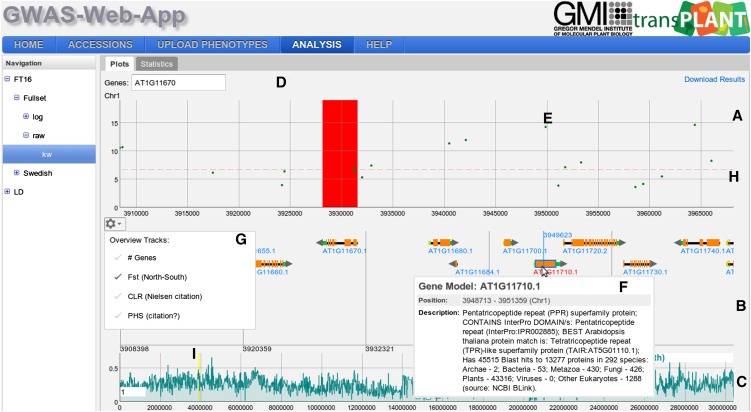
Figure 4.
Result View.
The result view displays GWAS plots for each of the five chromosomes. Each GWAS plot itself consists of three panels. The top panel (A) contains a scatterplot. The positions on the chromosome are on the x axis and the score on the y axis. The dots in the scatterplot represent SNPs (E). A horizontal dashed line (H) shows the 5% FDR threshold. At the top of the GWAS results view, a search box for genes is displayed (D). These genes will be displayed as a colored band (red in the figure). The second panel (B) shows the gene annotation and is only shown for a specific zoom range (<1.5 Mb). It will display genes, gene features, and gene names. Moving the mouse over a gene will display additional information in a pop-up (F), and clicking on a gene will open the TAIR page for the specific gene. Panel (C) displays various chromosome-wide statistics. The region highlighted by a yellow band (I) is shown in the scatterplot and in the gene annotation. The gear icon opens a pop-up (G) with the available statistics the user can choose from.

