Figure 3.
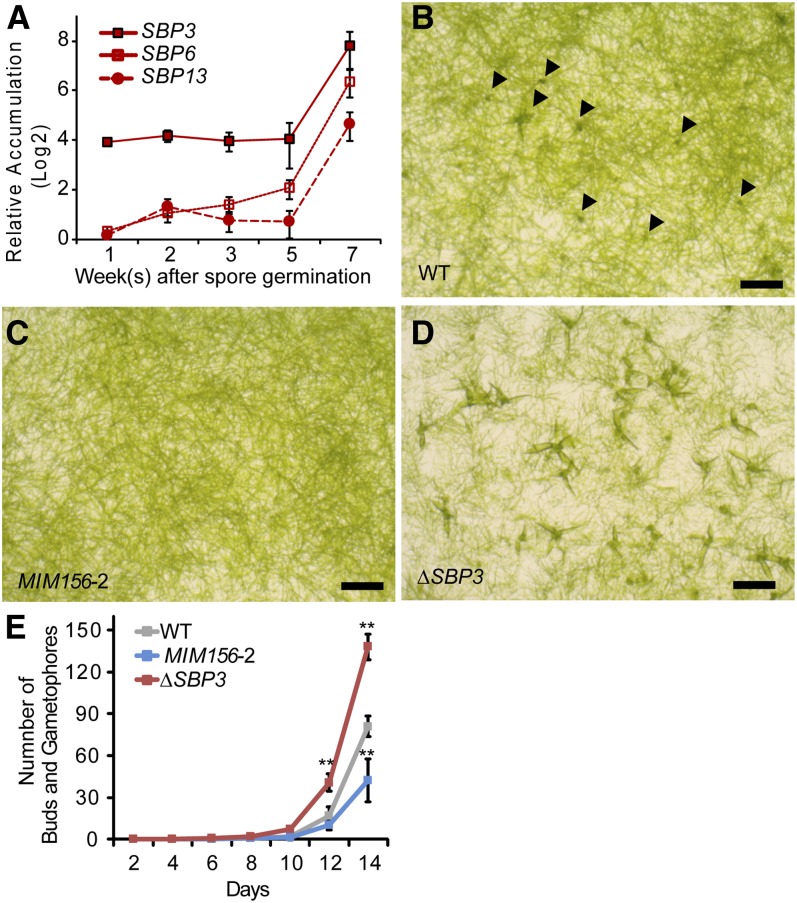
SBP3 Represses Bud and Leafy Gametophore Formation.
(A) Accumulation of SBP transcripts during the P. patens life cycle. Expression levels relative to EF1α in a sample were plotted. Error bars indicate sd from three biological replicates. Analyses of significant differences are shown in Supplemental Figure 4 online.
(B) to (D) Opposite effects of miR156 and SBP3 upon bud formation. Blended protonemal tissues of the wild type (WT) (B), MIM156-2 (C), and ΔSBP3 (D) were plated on cellophane overlaid media and incubated for 2 weeks. Arrowheads in (B) indicate buds. Bars = 1 mm.
(E) Rates of bud and gametophore appearance. Seven-day-old protonemal tissues were inoculated on media. The numbers of buds and subsequent gametophores in four colonies were counted every 2 days. Error bars represent sd of four replicates. Significant differences from the wild type on each day were analyzed by t test (*P ≤ 0.05 and **P ≤ 0.01).

