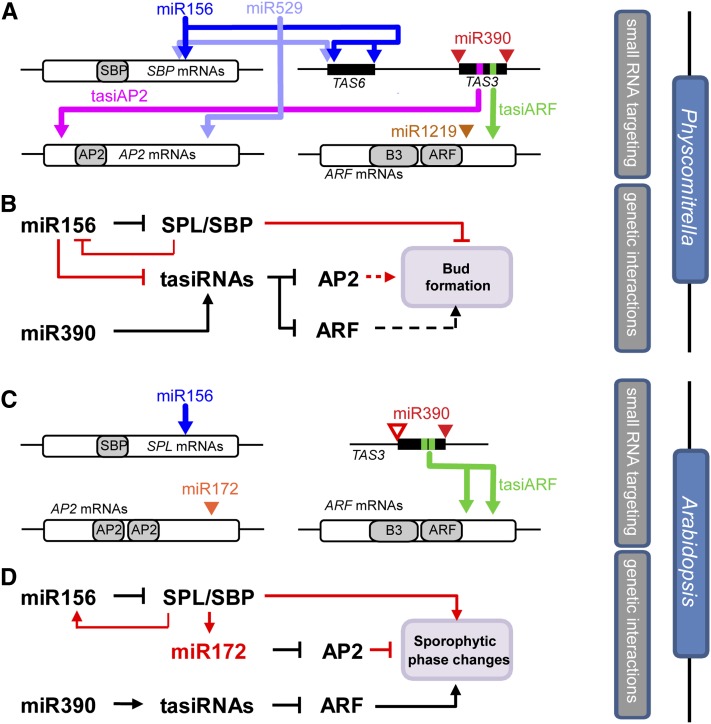
Figure 7.
Comparison of Small RNA/Target and Genetic Networks Controlling Developmental Transitions between P. patens and Arabidopsis.
(A) Small RNA–target interactions in P. patens. Colored arrows indicate small RNA targeting, open rectangles indicate open reading frames, gray regions indicate protein domains, and filled rectangles indicate regions of phased siRNA production. Not to scale.
(B) Genetic interactions controlling bud formation and leafy gametophore formation in P. patens. Interactions in red differ when compared with Arabidopsis; those in black are conserved. Dotted lines indicate hypothetical interactions.
(C) to (D) As in (A) and (B), respectively, for Arabidopsis. Empty triangle in (C) reflects the nonslicing miR390 site found in Arabidopsis TAS3 loci.

