Figure 6.
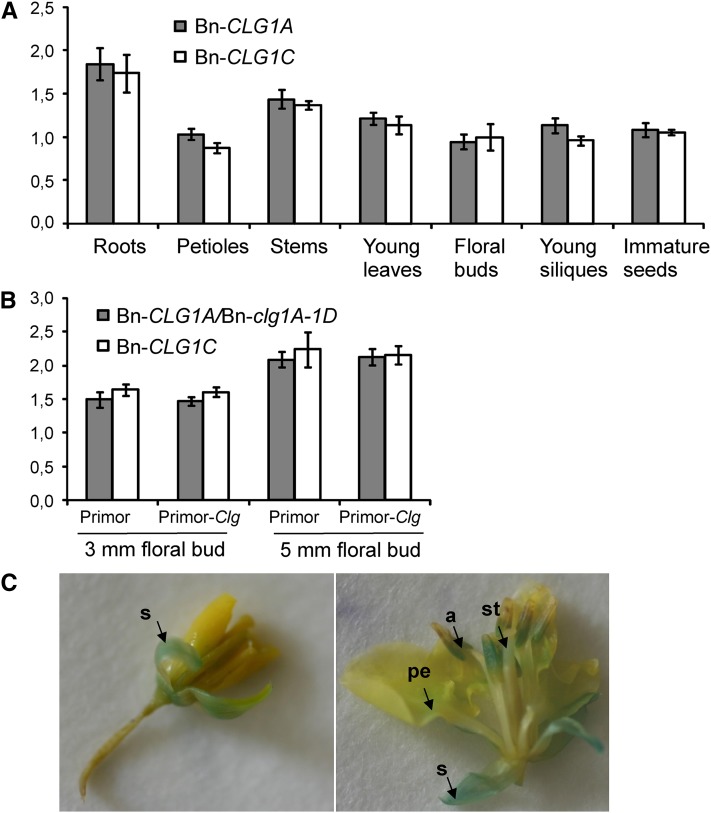
Bn-clg1A-1D, Bn-CLG1A, and Bn-CLG1C Homoeologs Are Constitutively and Similarly Expressed in B. napus.
(A) Bn-CLG1A and Bn-CLG1C expression levels in different tissues of B. napus cv Darmor. Transcript levels were determined by quantitative RT-PCR and normalized to both EF-1 and UBQ2 genes. Bars indicate sd (n = 3).
(B) Bn-clg1A-1D and Bn-CLG1C expression levels in B. napus cv Primor (the wild type) and Primor-Clg (Bn-clg1A-1D mutant) 3- and 5-mm floral buds. Transcript levels were determined by quantitative RT-PCR and normalized to both EF-1 and UBQ2. Bars indicate sd (n = 3). The experiments have been repeated twice with similar results.
(C) GUS assay on young (left) and old (right) flowers of transgenic B. napus cv Westar transformed with the pBn-CLG1A:GUS construct. Arrows indicate the accumulation of GUS product (blue staining) in sepal (s), the base of petal (pe), anther (a), and style (st) of a developing flower.
[See online article for color version of this figure.]

