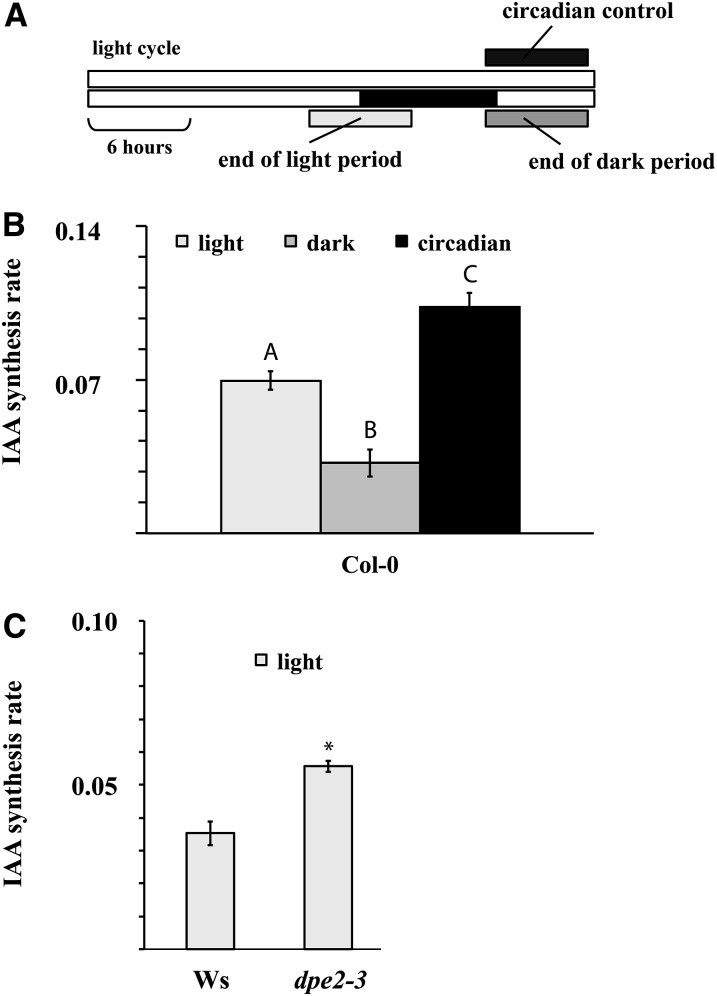
Figure 5.
IAA Synthesis Rates Correlate with Cytosolic Carbon Metabolism.
(A) Schematic representation of the experimental setup. Two 6-h dark incubations were made, presented as gray bars, one at the end of the light period, and the other at the end of the dark period. Plants illuminated through the dark period (circadian control) were incubated in the same way.
(B) IAA synthesis rates in wild-type Col-0 seedlings after incubation in medium containing deuterated water as described in (A). Bars not connected with a letter indicate a statistical difference at 95% confidence level. Error bars indicate sd (n = 4).
(C) IAA synthesis rates in wild-type Ws and the hexose-accumulating line dpe2-3. The seedlings were incubated in the end of the light period. Error bars indicate sd (n = 4).

