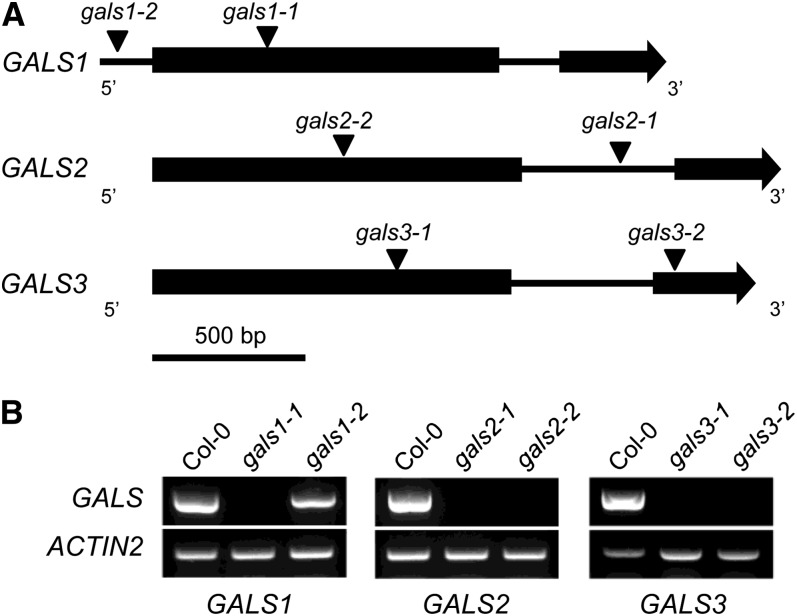
Figure 1.
Schematic Gene Models and Transcript Analysis of GALS1, GALS2, and GALS3 and T-DNA Mutants.
(A) Intron-exon structure of genes (exons shown as boxes and introns and 5′ regions as lines) and T-DNA insertions of mutants (triangles).
(B) RT-PCR analysis showing the lack of transcript in gals1-1 (Salk_016687), gals2-1 (Salk_121802), gals2-2 (GK-290D05), gals3-1 (WiscDsLox377-380G11), and gals3-2 (GK-133F03) mutants compared with Col-0 wild-type plants. The analyses were done with three biological replicates for each line. The gals1-2 mutant (WiscDsLox443D3) is leaky. ACTIN2 was amplified as the loading control (bottom panel). Mutant lines (Alonso et al., 2003; Woody et al., 2007; Kleinboelting et al., 2012) were obtained from the ABRC.

