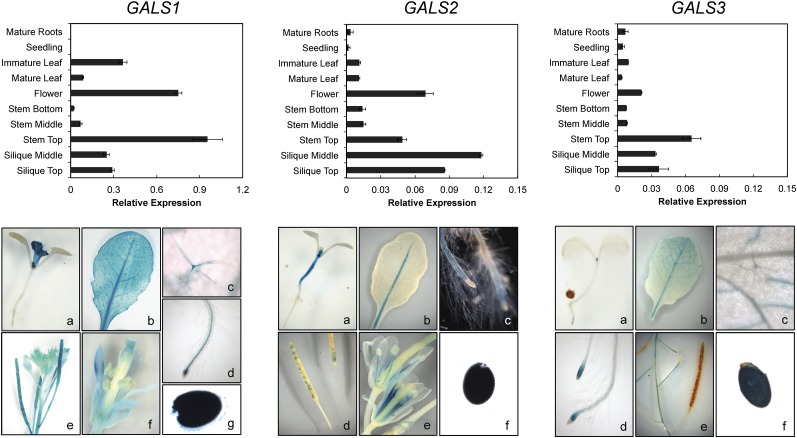
Figure 3.
Expression Pattern of the GALS1, GALS2, and GALS3 Genes.
Top panels: RT-PCR analysis of GALS1, GALS2, and GALS3 expression in major organs during development. The level of expression is calculated relative to the UBQ10 gene (mean ± sd of three biological replicates). Note the different scale for GALS1. Bottom panels: GUS activity patterns in transgenic Arabidopsis plants expressing the GUS reporter gene fused to the GALS1, GALS2, and GALS3 promoter, respectively. Expression analysis of GALS1 as revealed by promoter GUS analysis showing activity in a 9-d-old seedling (a), mature leaf (b), trichome (c), root vasculature (d), siliques (e), floral tissue (f), and seeds (g). GUS expression of GALS2pro:GUS plants revealed expression in the stem of 6-d-old seedlings (a), the midrib of a mature leaf (b), the root vasculature (c), siliques (d), flower filaments (e), and seeds (f). GUS activity pattern of GALS3pro:GUS plants showing staining in a 6-d-old seedling (a), mature leaf (b), root cap (d), top of the stem (e), and seed (f), but not in trichomes (c).
[See online article for color version of this figure.]

