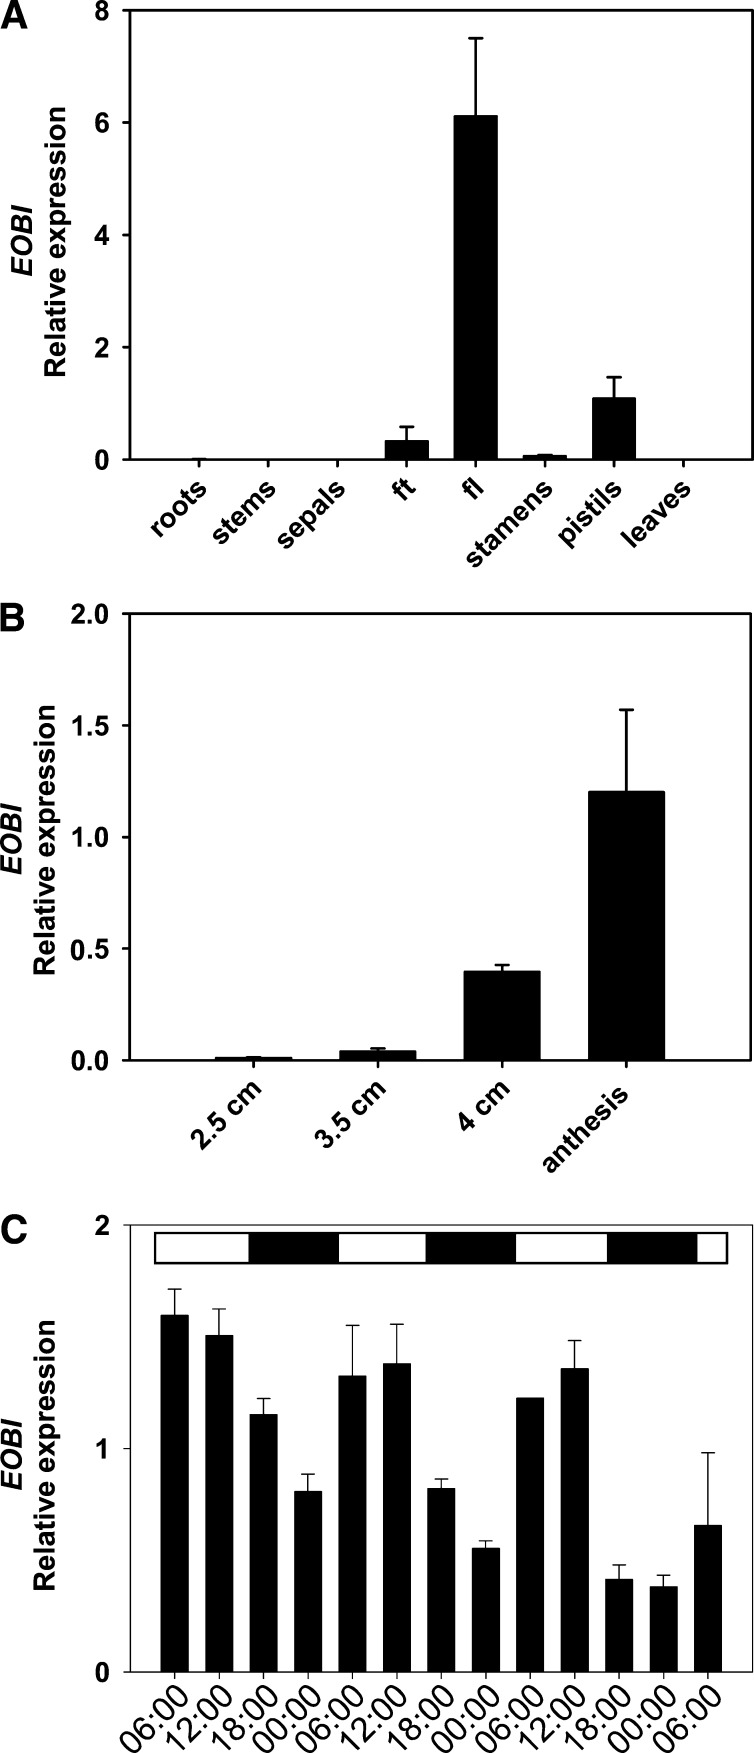
Figure 3.
Spatial, Developmental, and Temporal Regulation of EOBI Transcript Levels.
Petunia line P720 RNA was extracted from different organs (A), corollas at different developmental stages (B), and corollas at different time points during the day/night (C) for three consecutive days (starting at anthesis at 06:00). EOBI transcript levels were determined by quantitative real-time PCR analysis using Actin as the reference. Graphs represent the average of three to five biological replicates (each consisting of three technical repeats) with se indicated by vertical lines. Black part of horizontal bar in (C) indicates nighttime hours. fl, flower limb; ft, flower tube.

