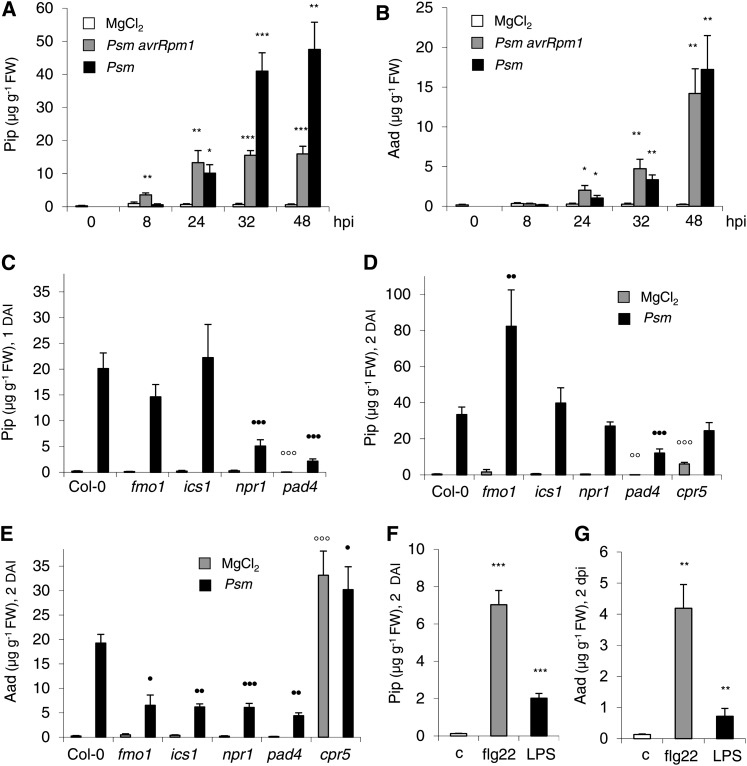
Figure 2.
Pip and Aad Accumulation in P. syringae–Inoculated and PAMP-Treated Arabidopsis Leaves.
(A) and (B) Time course of Pip (A) and Aad (B) accumulation in leaves inoculated with compatible Psm and incompatible Psm avrRpm1. FW, fresh weight; hpi, hours postinoculation.
(C) and (D) Accumulation of Pip in Psm-inoculated leaves of wild-type Col-0 and selected defense mutant plants at 1 DAI (C) and 2 DAI (D).
(E) Accumulation of Aad in Psm-inoculated leaves of wild-type Col-0 and selected defense mutant plants at 2 DAI.
(F) and (G) Leaf levels of Pip (F) and Aad (G) 2 d after leaf treatment with 10 mM MgCl2 (c), 200 nM flg22, and 100 µg mL−1 LPS purified from E. coli.
Data represent the mean ± sd of at least four replicate samples. In (A) and (B), asterisks denote statistically significant differences between P. syringae and MgCl2 samples and in (F) and (G) between control and PAMP samples (***P < 0.001, **P < 0.01, and *P < 0.05; two-tailed t test). In (C) and (D), open (closed) circles indicate statistically significant differences between an MgCl2 (Psm) mutant and the MgCl2 (Psm) wild-type sample (two-tailed t test).

