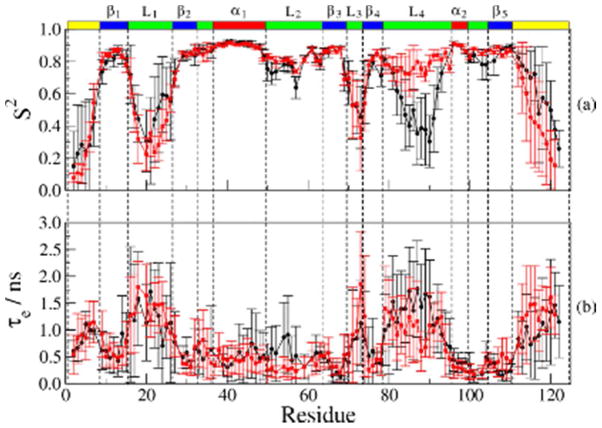
Figure 4.
Average S2 (a) and τe (b) values obtained with MD simulations for the RBD dimer as outlined in the text (shown as red squares). Average S2 and τe values obtained with MD simulations for the RBD monomer mutant are shown as black circles for comparison. The data of the monomer mutant were taken from ref 32.

