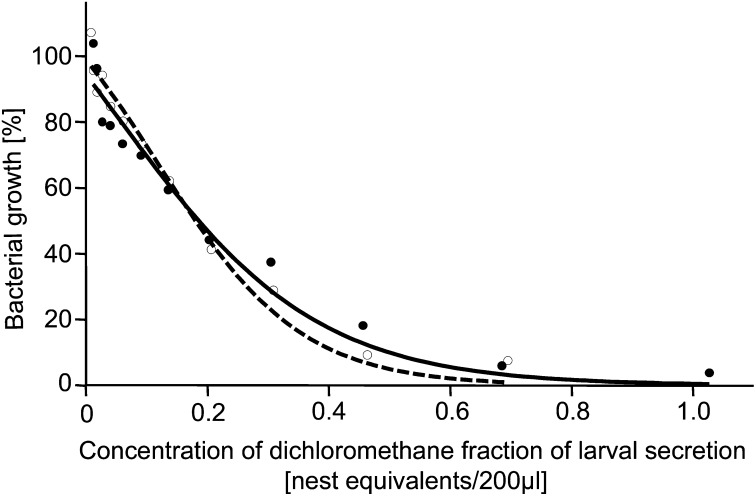
Fig. 3.
Percentage of growth relative to controls of bacteria grown in the presence of varying concentrations of the dichloromethane fraction of the larval secretion. Growth was measured as optical density in broth microdilution assays. Logistic regressions with Levenberg–Marquardt correction were fitted to the data. Open circles and dashed line: S. marcescens; filled circles and solid line: S. hyicus.

