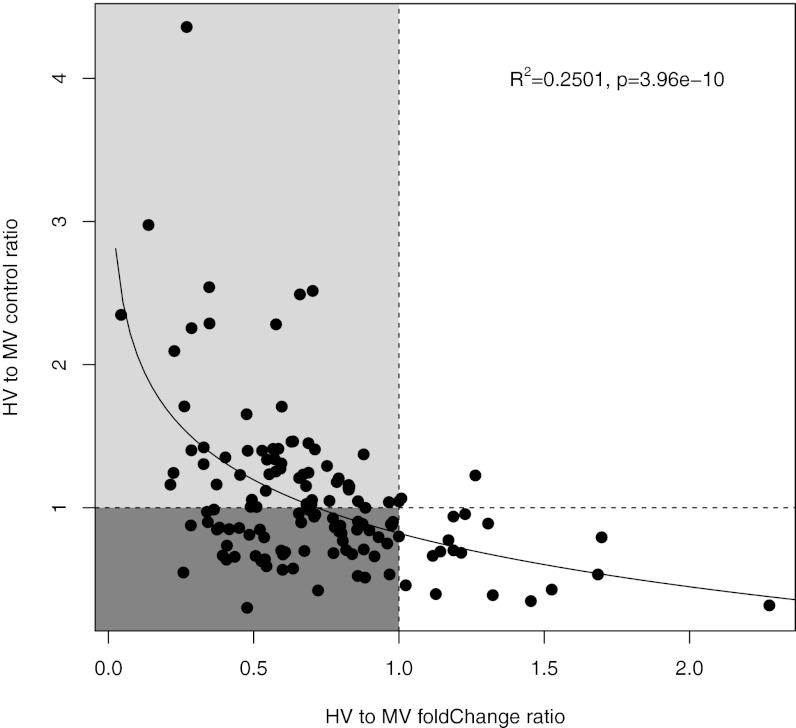
Fig. 4.
Scatterplot comparing the relative ratio of heat-to-control fold changes in expression between HV and MV corals (on the x axis) to the HV to MV control expression ratio (on the y axis) across the 135 up-regulated genes unique to the MV comparison set to examine whether HV controls show higher constitutive expression (points that are >1 on y axis) relative to MV controls for those genes with reduced response to heat stress in HV corals (points that are <1 on x axis). The lighter and darker portions of the graph represent the genes that are potentially frontloaded or stress indicators in expression, respectively. The trend line was calculated using a logarithmic regression, and associated R2 and P values are shown in the plot.

