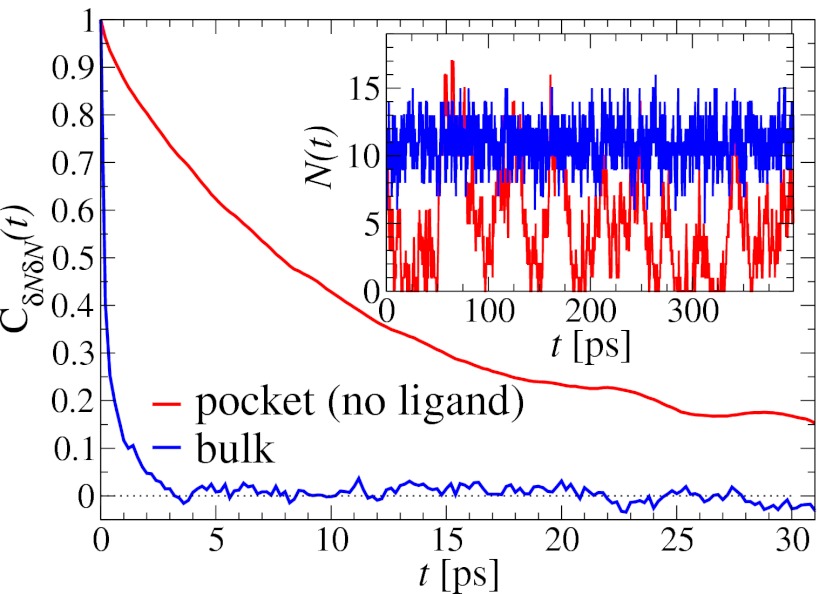
Fig. 3.
Normalized acf  of occupancy fluctuations in the pocket with the ligand far away in the bulk (red line) versus the acf of occupancy of bulk water in the same volume (blue line). Pocket fluctuations are 1 order of magnitude slower. (Inset) Pocket occupancy
  versus time t (red) compared with the occupancy of bulk water (blue).

